HelpDesk
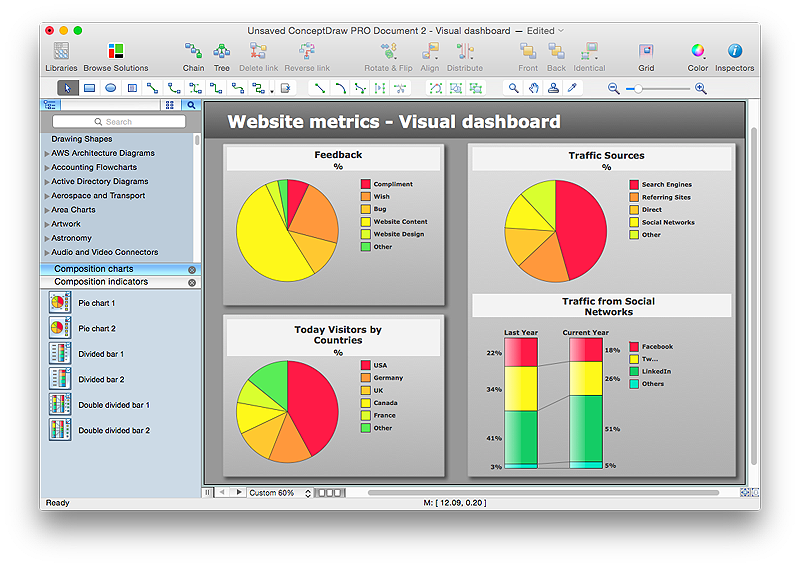
How to Connect a Live Object to a Text Data Source
Instruction on how to connect a ConceptDraw live object with data source files in TXT format to visualize the actual values of your performance metrics.
The vector stencils library "AWS Analytics" contains 21 icons: Amazon Athena icon, Amazon CloudSearch icons, Amazon EMR icons, Amazon ES icons, Amazon Kinesis icons, Amazon QuickSight icon, Amazon Redshift icons, AWS Data Pipeline icon.
Use it to draw Amazon Web Services architecture diagrams with ConceptDraw PRO diagramming and vector drawing software.
"Amazon Elasticsearch Service is a managed service that makes it easy to deploy, operate, and scale Elasticsearch in the AWS Cloud. Elasticsearch is a popular open-source search and analytics engine for use cases such as log analytics, real-time application monitoring, and click stream analytics." [aws.amazon.com/ elasticsearch-service/ ]
"Amazon Elastic MapReduce (Amazon EMR) is a web service that makes it easy to quickly and cost-effectively process vast amounts of data." [aws.amazon.com/ elasticmapreduce/ ]
"Amazon Kinesis is a platform for streaming data on AWS, offering powerful services to make it easy to load and analyze streaming data, and also providing the ability for you to build custom streaming data applications for specialized needs." [aws.amazon.com/ kinesis/ ]
"Amazon Machine Learning is a service that makes it easy for developers of all skill levels to use machine learning technology." [aws.amazon.com/ machine-learning/ ]
"Amazon QuickSight is a very fast, cloud-powered business intelligence (BI) service that makes it easy for all employees to build visualizations, perform ad-hoc analysis, and quickly get business insights from their data." [aws.amazon.com/ quicksight/ ]
"AWS Data Pipeline is a web service that helps you reliably process and move data between different AWS compute and storage services, as well as on-premise data sources, at specified intervals." [aws.amazon.com/ datapipeline/ ]
The AWS icons example "Design elements - AWS Analytics" is included in the AWS Architecture Diagrams solution from the Computer and Networks area of ConceptDraw Solution Park.
HelpDesk
How to Connect Text Data to a Time Series Chart on Your Live Dashboard
Time Series Dashboard means an integration of some type of diagrams: Line Charts, Bar Charts, Column Charts, and Dot Plots on a single space. The ConceptDraw Time Series Dashboard solution can be used to create the interactive Time Series dashboard. The libraries of Time Series Charts solution contain the Live Objects, that can change their appearance depending on the external data. Each chart from the Time Series dashboard displays particular source data. You can include Time Series Charts in your business or technical dashboards to show and compare the items changing over time.
- How to Connect a Live Object to a Text Data Source | Basic ...
- Icon For Library Dashboard
- Diagramming software for Amazon Web Service icon set ...
- How to Input Data from MS Excel Into a Mind Map | Process ...
- Top 5 Android Flow Chart Apps | Design elements - Android system ...
- Cisco Routers. Cisco icons , shapes, stencils and symbols | Cisco ...
- App icons - Vector stencils library | Example of DFD for Online Store ...
- App icons - Vector stencils library | Process Flowchart | Data Flow ...
- Diagramming software for Amazon Web Service icon set
- Kpi Icon Png
- Cisco IBM. Cisco icons , shapes, stencils and symbols | Data Flow ...
- Voice Data Symbol
- Glyph icons - Vector stencils library | Window elements - Vector ...
- How to Connect a Live Object to a Text Data Source | How to ...
- Electrical Symbols — Power Sources | Electrical Symbols — Thermo ...
- AWS Simple Icons for Architecture Diagrams | Amazon Web ...
- Time Sheet Icon Png
- Electrical Symbols — Power Sources | Electrical Drawing Software ...
- Flowchart design. Flowchart symbols, shapes, stencils and icons ...
- Ad Agency Icon

