"A thematic map is a type of map or chart especially designed to show a particular theme connected with a specific geographic area. ...
A thematic map is a map that focuses on a specific theme or subject area, whereas in a general map the variety of phenomena - geological, geographical, political - regularly appear together. ...
Thematic maps emphasize spatial variation of one or a small number of geographic distributions. These distributions may be physical phenomena such as climate or human characteristics such as population density and health issues. ...
Thematic map are sometimes referred to as graphic essays that portray spatial variations and interrelationships of geographical distributions. Location, of course, is important to provide a reference base of where selected phenomena are occurring. ...
Thematic maps serve three primary purposes.
First, they provide specific information about particular locations.
Second, they provide general information about spatial patterns.
Third, they can be used to compare patterns on two or more maps." [Thematic map. Wikipedia]
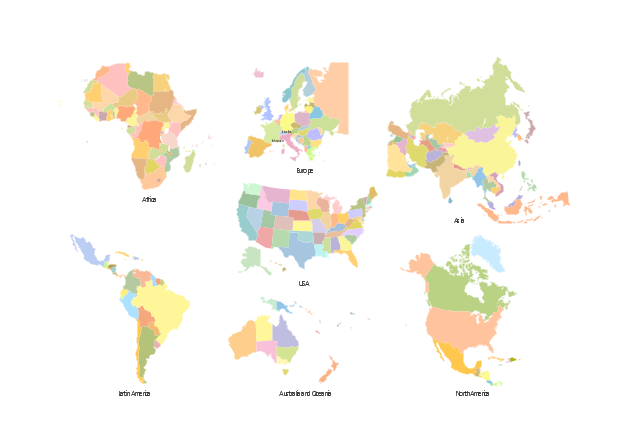
The vector stencils library "Thematic maps" contains 7 continent map contours for creating the thematic maps of geographic regions displaying the metric values by countries, states and territories marked by different colors.
Use the design elements library "Thematic maps" to create spatial dashboards using the ConceptDraw PRO diagramming and vector drawing software for your Spatial Intelligence and Location Intelligence business practice.
The example "Design elements - Thematic maps" is included in the Spatial Dashboard solution from the area "What is a Dashboard" of ConceptDraw Solution Park.
 Spatial Dashboard
Spatial dashboard solution extends ConceptDraw PRO software with templates, samples and vector stencils libraries with thematic maps for drawing visual dashboards showing spatial data.
 Spatial Infographics
Spatial infographics solution extends ConceptDraw PRO software with infographic samples, map templates and vector stencils libraries with design elements for drawing spatial information graphics.
HelpDesk
How to Create Infographics Using the Spatial Infographics Solution
Tips on how to use ConceptDraw Spatial Infographics Solution. Now you got the tool for quick and easy drawing and presenting of your own simple Spatial Infographics documents.
 PM Dashboards
This solution extends ConceptDraw PRO and ConceptDraw PROJECT software with the ability to clearly display the identified key performance indicators for any project.
HelpDesk
How to Use ConceptDraw Sales Dashboard Solution
The interactive visual dashboard is a valuable tool for any sales team. Sales dashboard allows you to view and monitor sales indicators that are important for manager and sales staff . It helps to use the timely and reliable information to improve the quality of sales performance and increase sales revenues. ConceptDraw Sales Dashboard solution is a tool for both: sales manager and sales team. It provides the visualization of key performance indicators that are critical to the entire sales organization. The custom sales dashboard displays the real-time information on sales performance KPIs with the help of intuitive and easy-to-understand diagrams and charts. Sales Dashboard helps the entire team see where they are, and what needs to be done. With ConceptDraw PRO you can easily create a visual Sales Dashboard using Live Objects Technology.
 Time Series Dashboard
Time series dashboard solution extends ConceptDraw PRO software with templates, samples and vector stencils libraries with charts, graphs and plots for drawing the visual dashboards showing data time series.
 What is a Dashboard Area
Solutions from the area What is a Dashboard of ConceptDraw Solution Park collects templates, samples and vector stencils libraries with of data driven charts and indicators for drawing the basic types of Visual Dashboards.
 ConceptDraw Solution Park
ConceptDraw Solution Park collects graphic extensions, examples and learning materials
- What is Infographics Area | Spatial Infographics ... - Conceptdraw.com
- Comparison Dashboard | What is a Dashboard Area | Spatial ...
- Spatial Dashboard | Meter Dashboard | Status Dashboard |
- Meter Dashboard | Status Dashboard | Spatial Dashboard |
- Spatial Dashboard | Spatial Infographics | Design elements ...
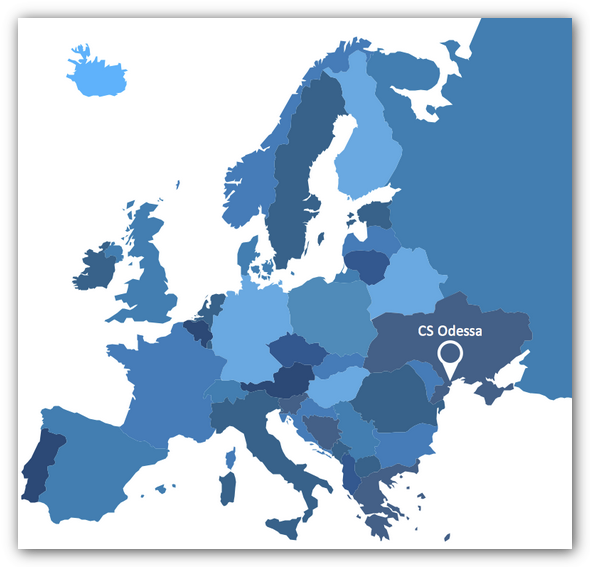
- Spatial Dashboard | Spatial dashboard sample | Europe spatial ...
- KPIs and Metrics | Cafe performance metrics vs. air temperature ...
- Meter Dashboard | Composition Dashboard | Spatial Dashboard |
- Sales Dashboard | Spatial dashboard sample | Meter Dashboard |
- Sales Dashboard Template | Europe spatial dashboard template ...
- Spatial Dashboard | Composition Dashboard | Frequency ...
- KPIs and Metrics | What is a Dashboard Area | PM Dashboards |
- Visualization Spatial Data Using Thematic Maps Combined with ...
- ConceptDraw Dashboard for Facebook ... - Conceptdraw.com
- Status Dashboard | PM Dashboards | Sales Dashboard Examples |
- PM Dashboards | Total Quality Management TQM Diagrams | What ...
- KPIs and Metrics | Spatial Dashboard | What is a Dashboard Area |
- Spatial infographics Design Elements: Continental Map | Spatial ...
- Meter Dashboard | Spatial dashboard sample | Sales Dashboard |
- Total Quality Management TQM Diagrams | Meter Dashboard ...


