What Is a Circle Spoke Diagram
What Is a Circle Spoke Diagram? It is a diagram which have a central item surrounded by other items in a circle. The Circle Spoke Diagrams are often used to show the features or components of the central item in marketing and management documents and presentations. ConceptDraw PRO extended with Circle-Spoke Diagrams Solution from the "What is a Diagram" Area is the best software for creating Circle-Spoke Diagrams.Circle Spoke Diagram Template
ConceptDraw PRO diagramming and vector drawing software offers the Circle Spoke Diagram Template included in the Circle-Spoke Diagrams Solution from the "What is a Diagram" Area. Use of ready template is the easiest way of drawing professional looking Circle-Spoke Diagrams.CCTV Network Example
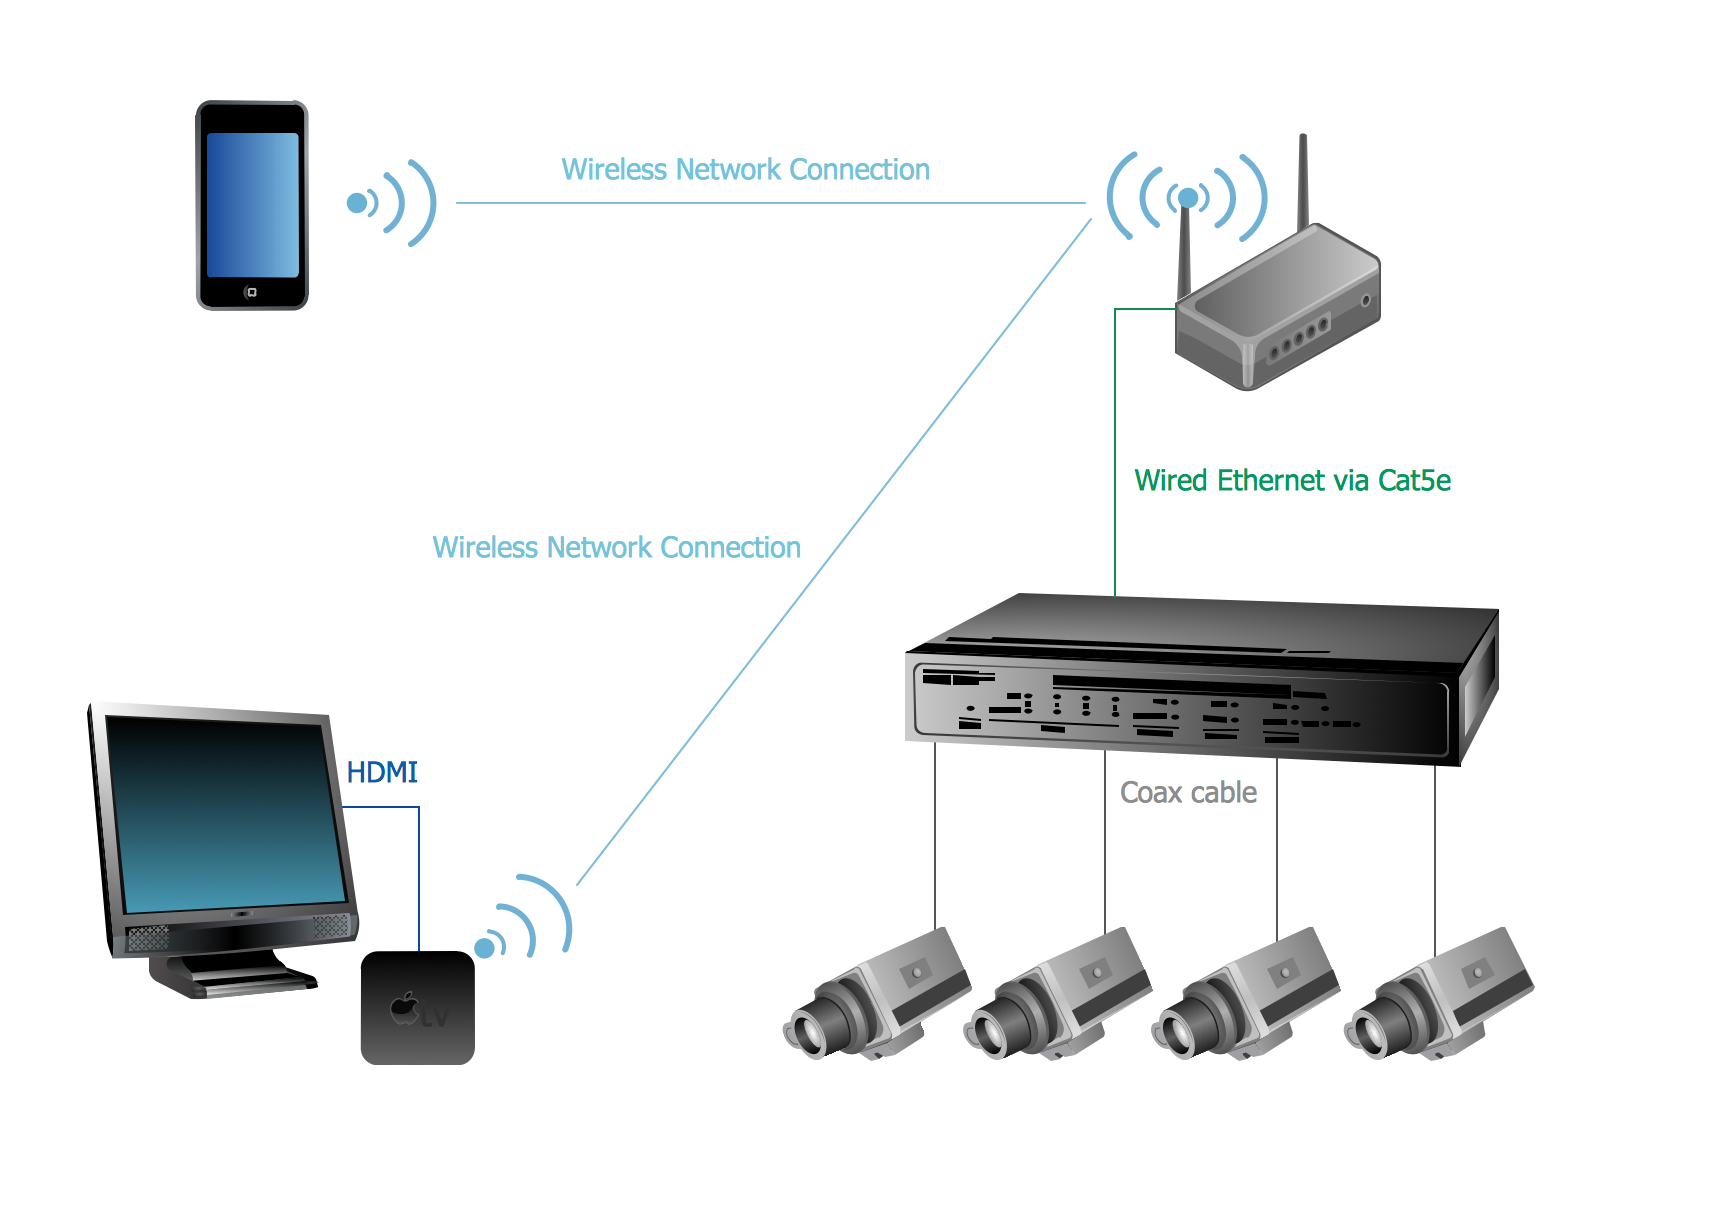
The following examples cctv network were created in ConceptDraw PRO diagramming and vector drawing software using the Audio, Video, Media Solution. Using this easily customizable cctv network template you can represent any existing cctv network.Circle Diagrams
The Circle Diagrams are the diagrams which represent the central element surrounded by other items in a circle. This type of diagram is very popular and widely used in marketing and management, for process modeling, market, resource, time and cost analysis, for visualization causes and effects. If you dream to design the Circle Diagrams quick and easy – the ConceptDraw PRO software extended with Circle-Spoke Diagrams Solution from the "What is a Diagram" Area is exactly what you need.HelpDesk
How to Draw a Fishbone Diagram with ConceptDraw PRO
Fishbone (Ishikawa) Diagram is often used in business to determine the cause of some problem. A Fishbone diagram is also called cause-and-effect diagram.The main goal of the Fishbone diagram is to illustrate in a graphical way the relationship between a given outcome and all the factors that influence this outcome. The complete diagram resembles a fish skeleton as its name implies. Cause and Effect analysis is used in management to identify the possible causes of a problem in order to eliminate them. The ability to create a Fishbone Diagram is supported by the Fishbone Diagram solution.Technical Flow Chart Example
What illustrates a technical flow chart? Technical flow chart is a diagrammatic representation which visually illustrates the sequence of operations that must to be performed to get the problem's solution. ConceptDraw PRO enhanced with Flowcharts Solution from the "What is a Diagram" Area of ConceptDraw Solution is a perfect software for drawing Technical Flow Chart Example illustrating the essence and importance of the technical flow chart use.Best Diagramming
Need to draw a diagram, process chart, flowchart, organizational chart, graphic design? ConceptDraw can help you to make professional graphic documents quickly.
 Marketing Area
The solutions from Marketing area of ConceptDraw Solution Park collect templates, samples and libraries of vector stencils for drawing the marketing diagrams and mind maps.
Agile Methodology
Agile methodology is an excellent alternative to waterfall and traditional sequential development. ConceptDraw PRO software extended with SCRUM Workflow solution is ideal for quick and easy designing various diagrams, charts, mind maps and schematics illustrating software development using Agile methodologies, and in particular Scrum methodology.Block Diagram Software
The popularity of Block Diagrams grows day by day. The existence of powerful software for their design is an excellent news! ConceptDraw PRO Block Diagram Software offers the Block Diagrams Solution from the "What is a Diagram" Area.
 Fishbone Diagrams
The Fishbone Diagrams solution extends ConceptDraw PRO v10 software with the ability to easily draw the Fishbone Diagrams (Ishikawa Diagrams) to clearly see the cause and effect analysis and also problem solving. The vector graphic diagrams produced using this solution can be used in whitepapers, presentations, datasheets, posters, and published technical material.
Circular Arrows
The Circular Arrows Diagrams are very popular in management and marketing. They are the useful way to visualize a sequence of steps, tasks, or events as a circular flow. But how design the Circular Arrows Diagram quick and easy? You will need a powerful software. ConceptDraw PRO diagramming and vector drawing software is exactly what you need. Extended with Circular Arrows Diagrams solution from the "What is a Diagram" Area, ConceptDraw PRO is the best for drawing the Circular Arrows Diagrams.Venn Diagram Maker
ConceptDraw PRO diagramming and vector drawing software extended with Venn Diagrams solution from the "What is a Diagram" area of ConceptDraw Solution Park is a powerful Venn Diagram maker. Create fast and easy your own Venn Diagrams to visualize: all the possible logical relations between sets, simple set relationships in logic, statistics, mathematics, sociology, marketing, summarize the status and future viability of a project.Best Multi-Platform Diagram Software
ConceptDraw PRO is a powerful tool for drawing business communication ideas and concepts, simple visual presentation of numerical data in the Mac environment.- Marketing | Competitor Analysis | Circle Spoke Diagram Template ...
- Brainstorming Diagrams
- Brainstorming Diagram Template
- Brainstorm Diagram
- Brainstorming Diagram
- Target market | Target and Circular Diagrams | Circle Spoke ...
- Six Markets Model Chart Template | Circle Spoke Diagram Template ...
- Types Of Brainstorming Diagrams
- Target and Circular Diagrams | ConceptDraw Solution Park ...
- Target market | Circle Spoke Diagram Template | Target and ...
- Circle- spoke diagram - Target market | Target diagrams - Vector ...
- Marketing mix - Wheel diagram | Target diagrams - Vector stencils ...
- Target Diagram | Circle- spoke diagram - Target market | Circular ...
- Design elements - Outdoor recreation space | ConceptDraw ...
- Six Markets Model Chart Template | How to Create the Custom ...
- How to Draw a Circle- Spoke Diagram Using ConceptDraw PRO ...
- Bubble Charts | Bubble Chart Maker | Bubble Map Maker ...
- Target Market Diagram
- Target Diagram | Target market | Target and Circular Diagrams ...
- Circle- Spoke Diagrams | Bubble Diagrams | Near-me area networks ...


