Flow Chart for Olympic Sports
Sports Selection Flow Chart - This sample was created in ConceptDraw DIAGRAM using the Flowcharts Solution from the Marketing Area and shows the Flow Chart of sport selection. An experienced user spent 10 minutes creating this sample.Building Drawing Software for Design Sport Fields
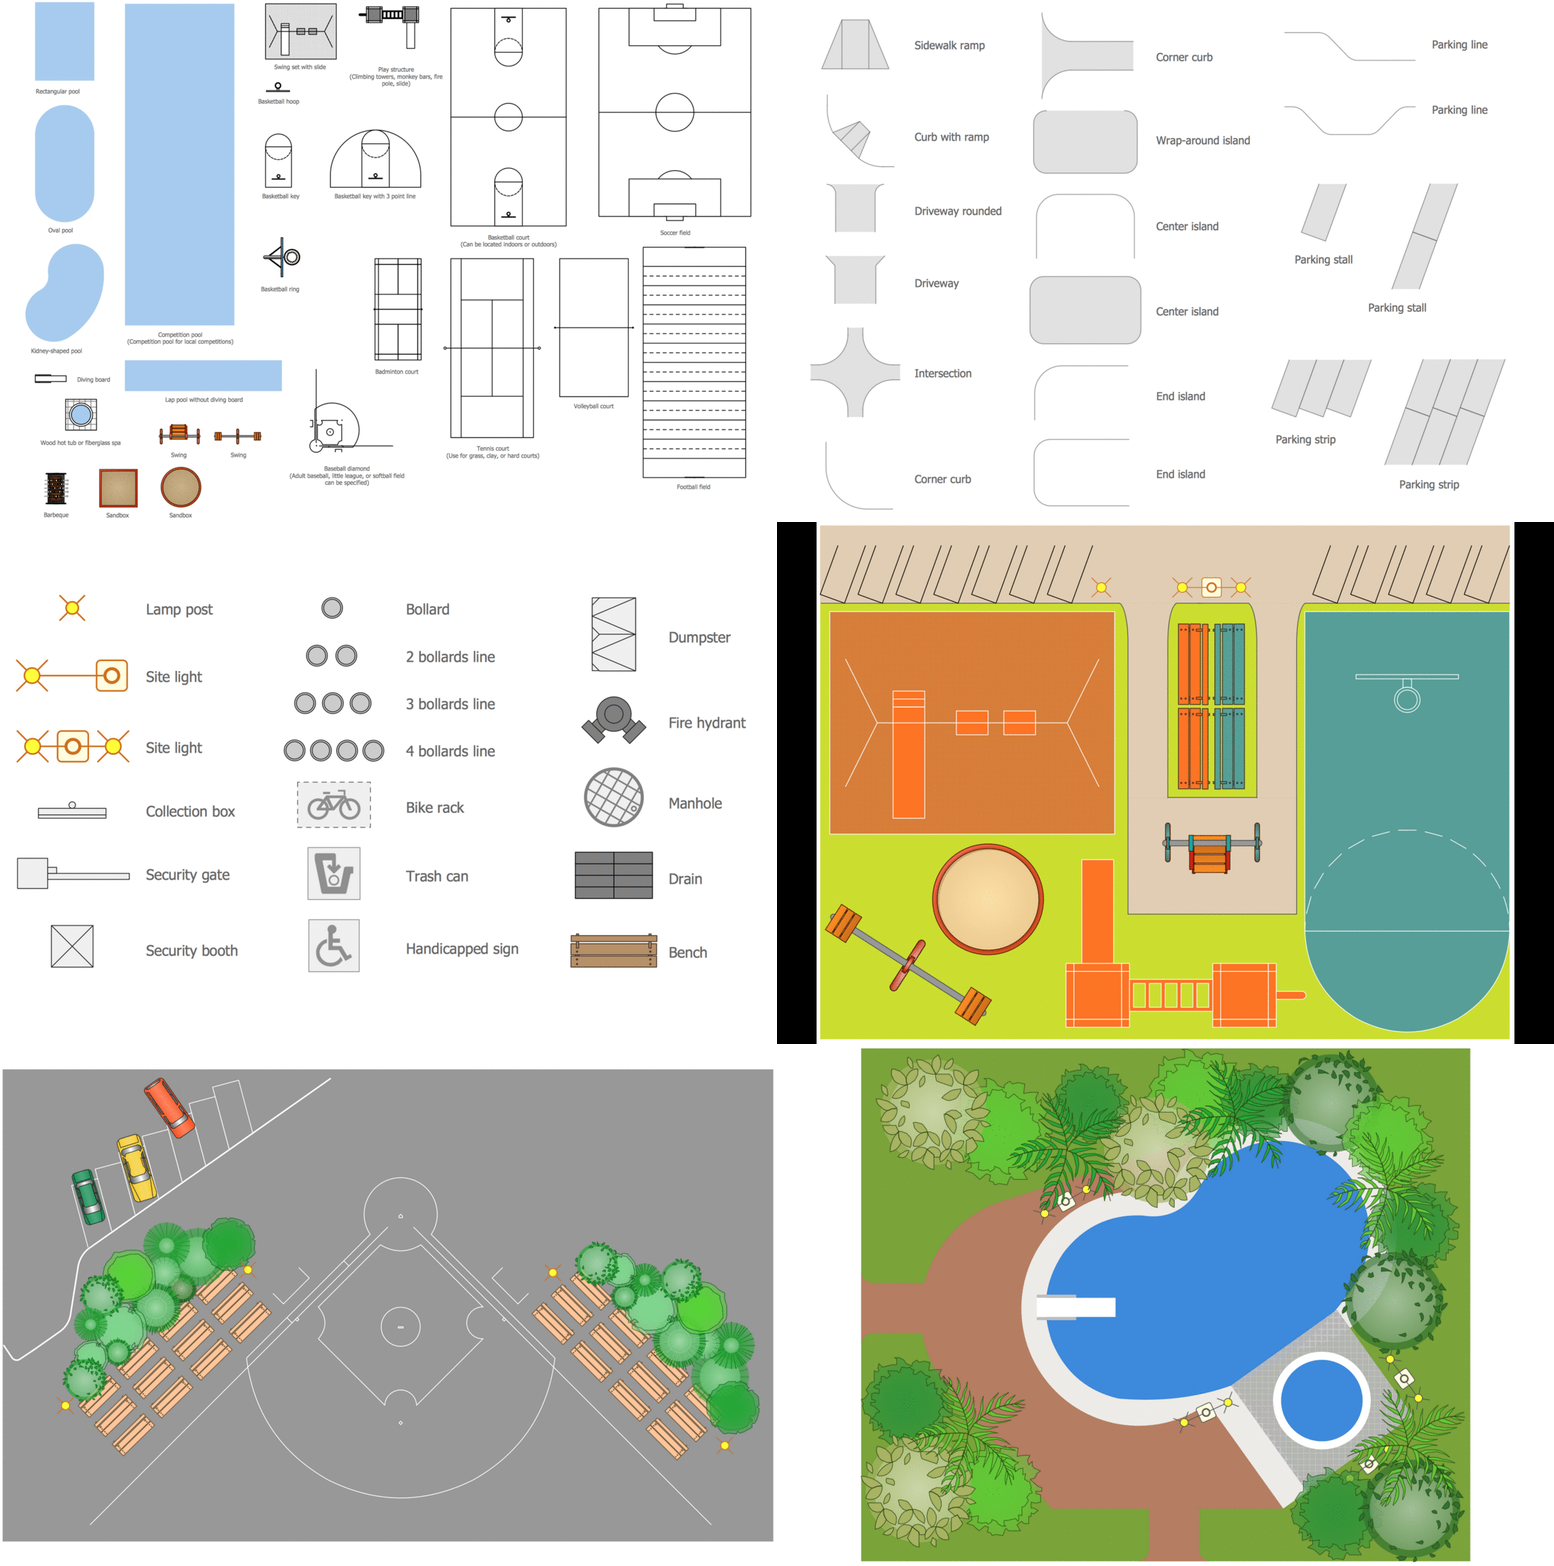
The sport fields, sport complexes, and sport grounds are popular places for all, but especially for children and teenagers who spend there a large amount of their time. So the sport fields must to be safe and carefully thought-out. Where to start and what things to consider when planning and building sport fields? First and foremost you need to take into account is that the fields for football, basketball, volleyball, tennis and other active sports differ by their dimensions, surface and design, and must to be constructed according to the rules for a given game. If the sport field assumes the presence of children of different age, you need organize the comfort staying them together. All installed elements and constructions should bring the maximum benefit and enjoyment from training. That's why the planning and construction the sport field cannot to be realized without a plan. ConceptDraw DIAGRAM building drawing software tools are perfect for design Sport Fields using the ready vector elements from the libraries of Sport Fields Plans solution from Building Plans area.
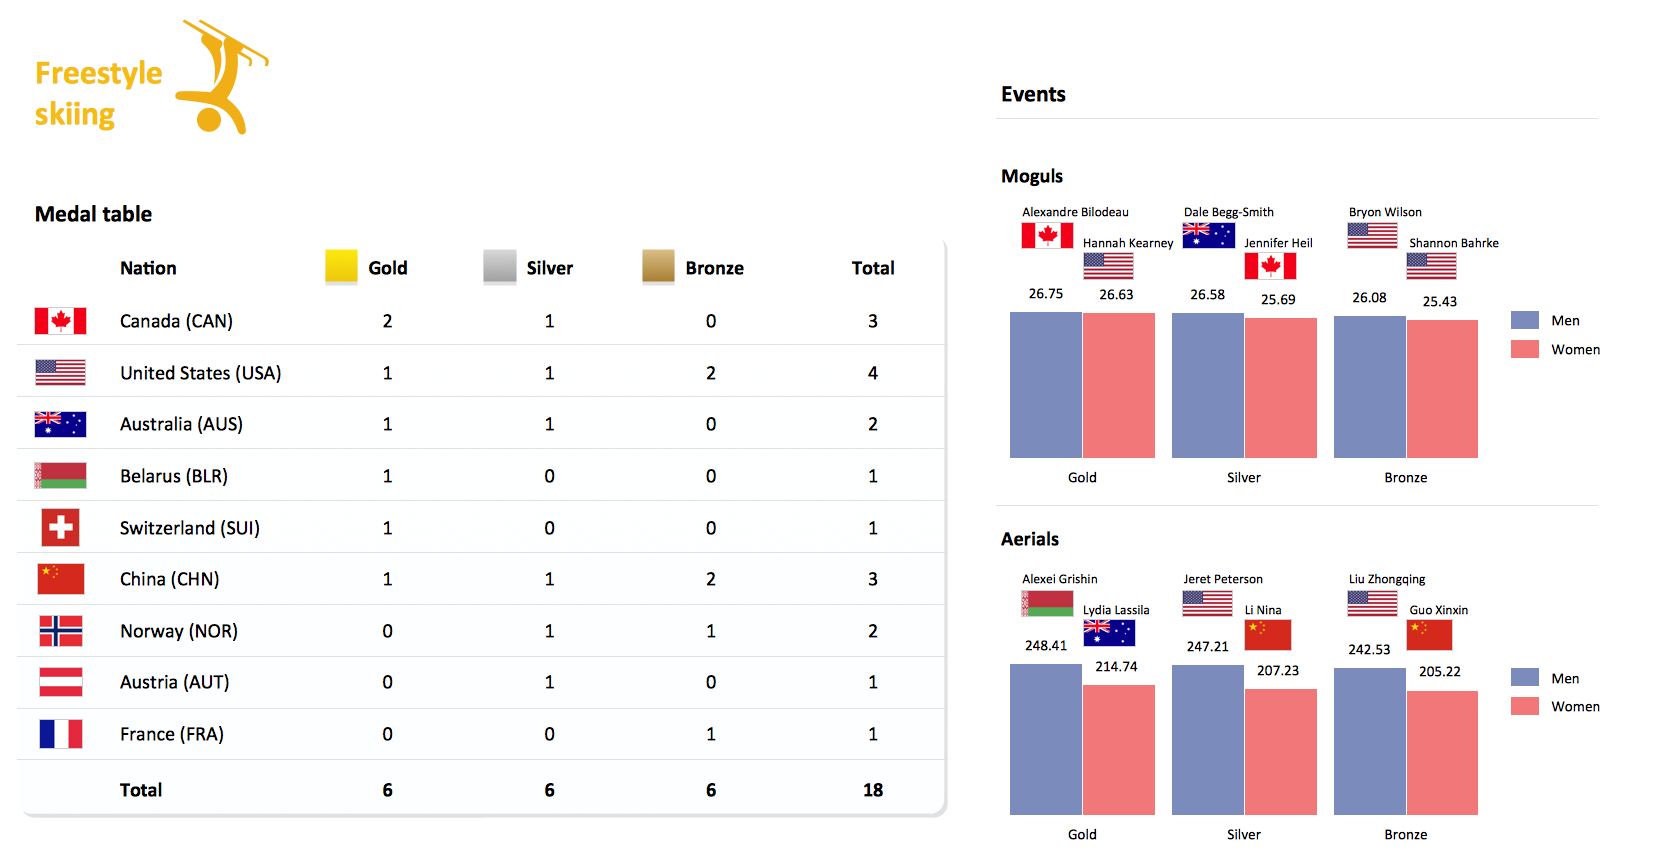
Winter Sports. Olympic Games Illustrations. Medal Summary
Do you like infographics and data visualization? Creating infographics is super-easy with ConceptDraw.Defensive Formation – 4-3 Defense Diagram
Using diagrams is the easiest way to explain American Football defensive formations. The Football solution for ConceptDraw DIAGRAM contains a set of samples depicts the most popular defensive formations diagrams. Using embedded presentation tools you are able to share your football knowledge with wide audience.Winter Sports Vector Clipart. Medal Map. Spatial Infographics
Tracking Olympic results in visual format is the most modern way to deliver statistics to a broad audience. This is a good example of an illustrated table you may easily modify, print, or publish on web from ConceptDraw Winter Sports solution.Diagram Flow Chart
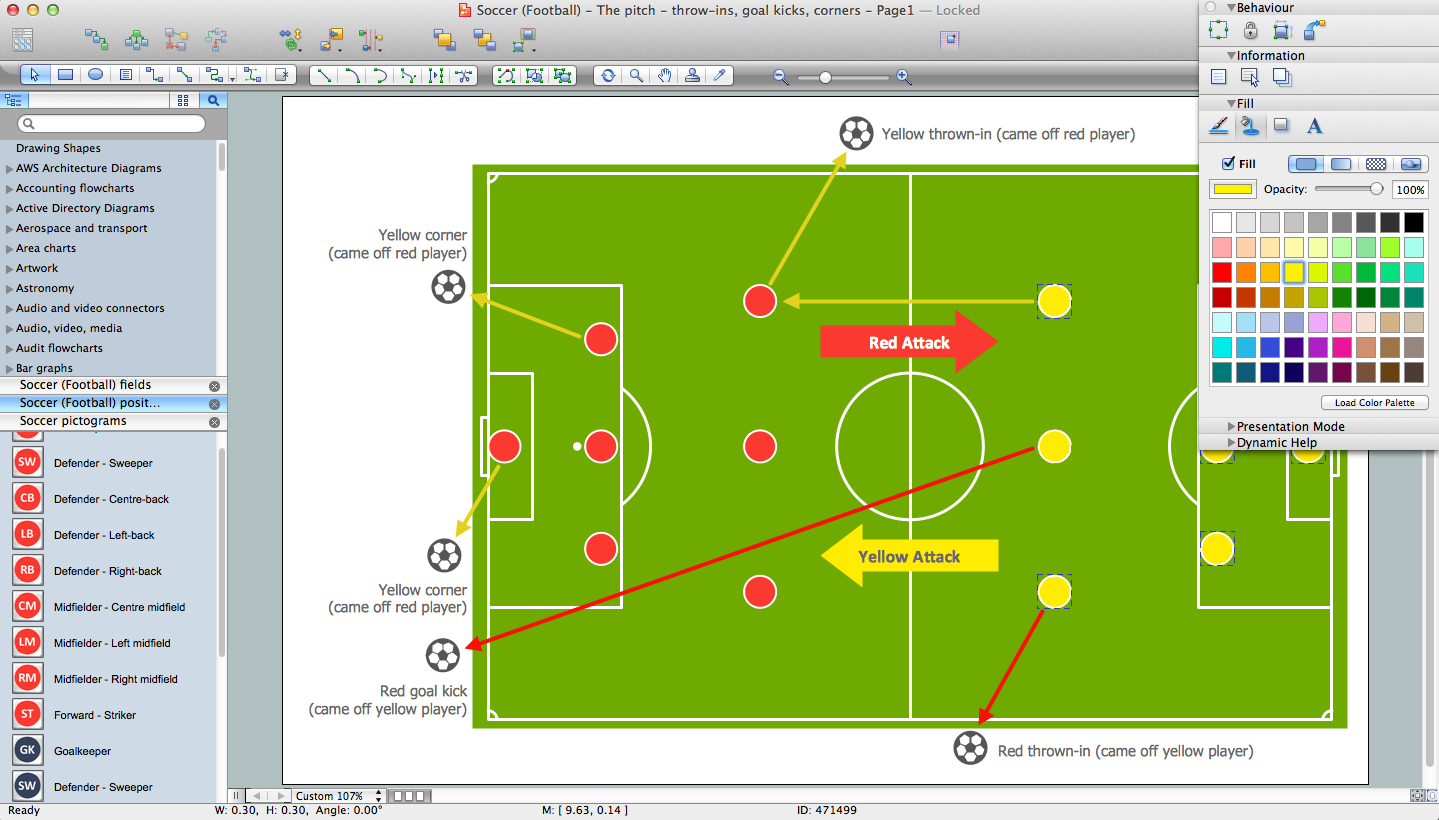
ConceptDraw DIAGRAM is a software for producing flow charts.Soccer (Football) Diagram Software
Explaining the soccer strategies and techniques is practically impossible without drawing a diagram. ConceptDraw DIAGRAM diagramming and vector drawing software extended with Soccer solution from the Sport area of ConceptDraw Solution Park is a very convenient and useful tool for designing the soccer-related diagrams.Sport pictograms. Olympic Games
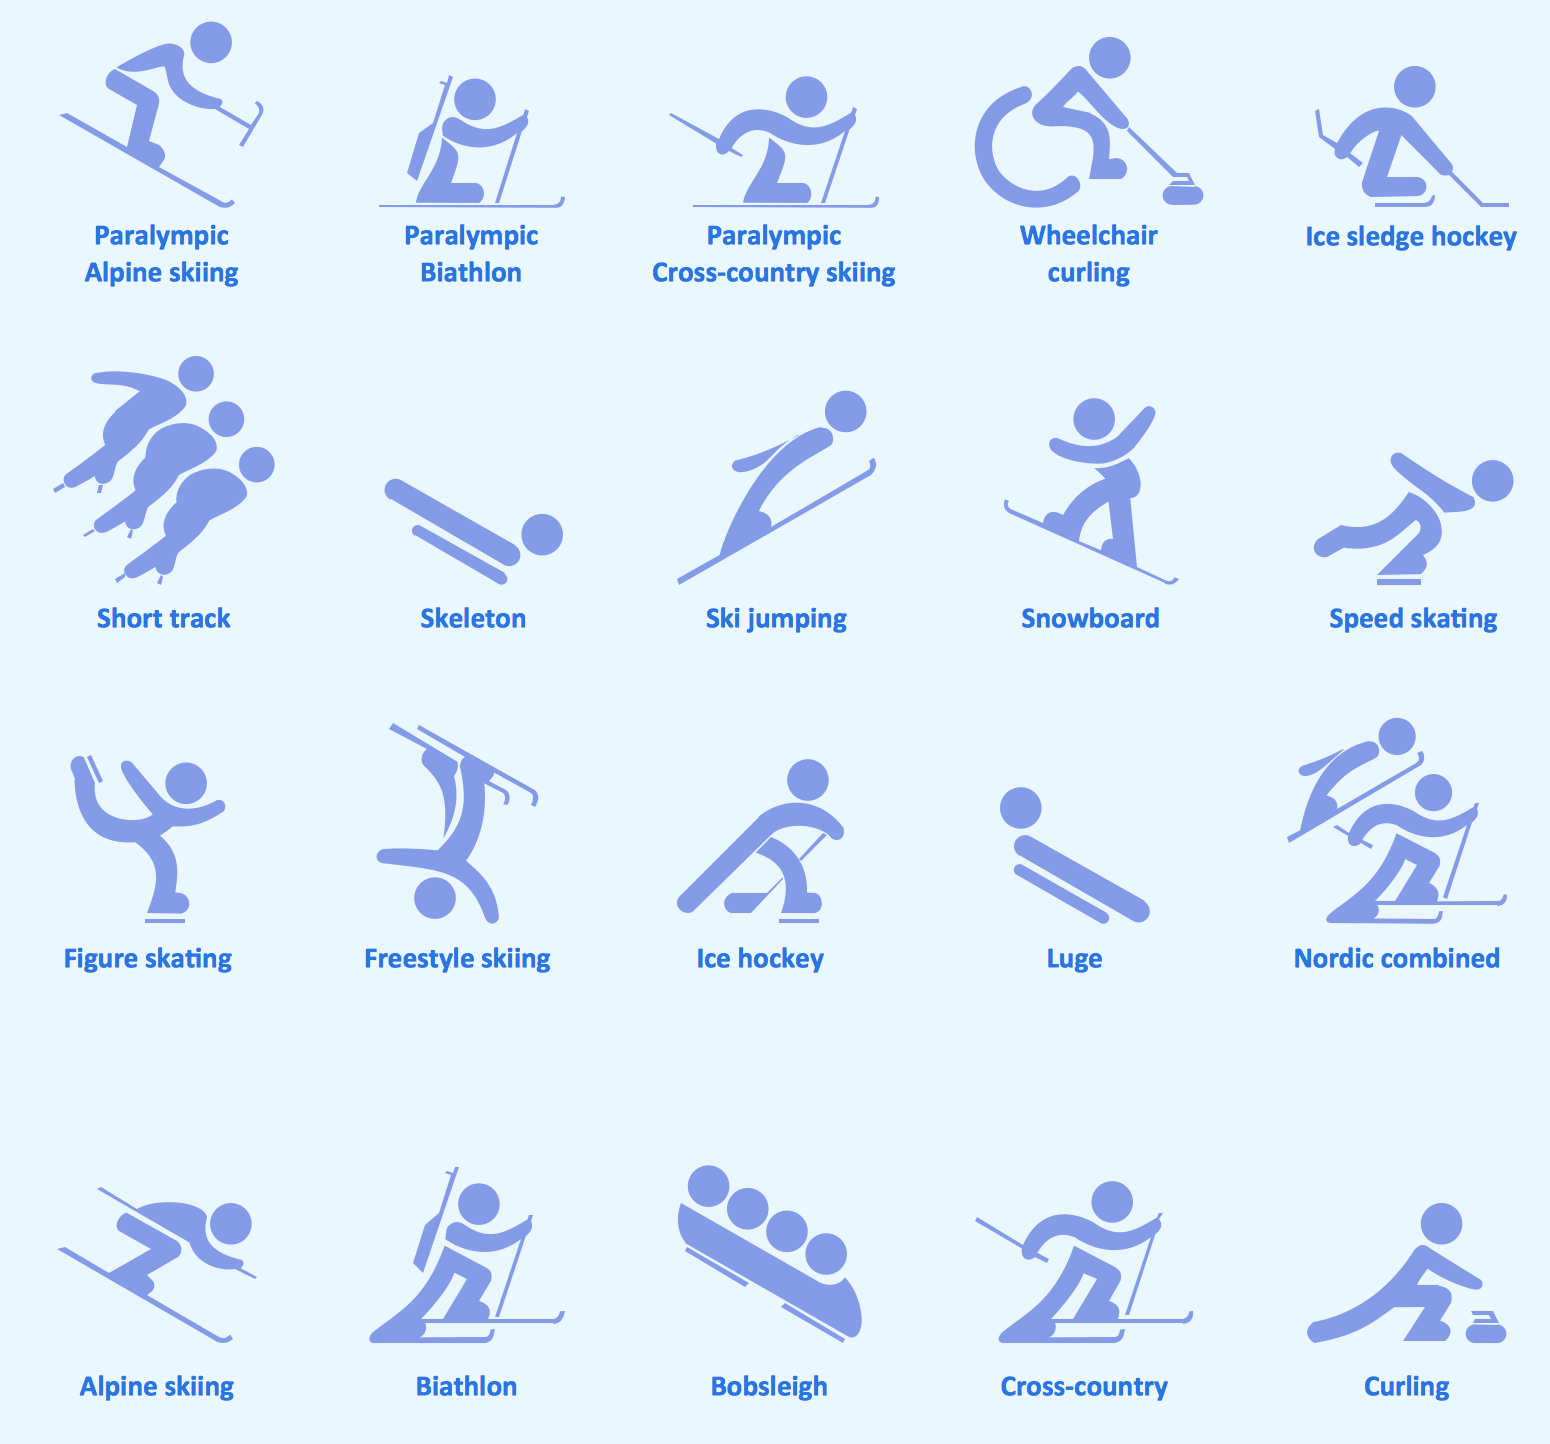
The Winter Sports solution from Sport Area of ConceptDraw Solution Park contains winter sports pictograms you may use illustrating any kind of material about Olympic Games or any other sport competitions.Pyramid Diagram and Pyramid Chart
Pyramid Diagram, Triangle Chart or Triangular Diagram is a convenient and useful type of diagrams, which lets represent the data hierarchical structure and to illustrate the foundation-based relationships between the hierarchy levels. Pyramid Diagrams are used to visualize effectively the hierarchical, as well as proportional and foundation-based relationships, the process steps, the interconnections of organizational layers or topics. ConceptDraw DIAGRAM software enhanced with Pyramid Diagrams solution from Marketing area of ConceptDraw Solution Park is a powerful business charting software, that includes all required tools for designing the multilevel Pyramid Diagrams as quickly as possible. The build-in vector stencils and templates are the great aid for designers, a variety of examples and samples is a good base and source of inspiration. Use attractive and vivid 2D and 3D Pyramid Diagrams and Triangle Charts designed in ConceptDraw DIAGRAM to illustrate your documents, presentations, infographics, articles, reports, websites, etc.- Soccer (Football) Diagram Software | Football | Sport Field Plans ...
- Sport Drawing Chart
- Bar Graphs | Organizational Charts | Winter Sports | National Park ...
- Diagram With Pictures Of All The Winter Olympic Events
- Bubble Diagrams | Chore charts with ConceptDraw PRO | Sport ...
- Basketball | How to Make a Basketball Court Diagram | Sport Field ...
- Football | Sport Field Plans | Draw And Label A Football Field Pictures
- Scatter Diagrams | PM Response | Draw A Picture Of Field And ...
- Sport Pictures


