"A 'Luge' ... is a small one- or two-person sled on which one sleds supine (face up) and feet-first. Steering is done by flexing the sled's runners with the calf of each leg or exerting opposite shoulder pressure to the seat. ... Luge is also the name of an Olympic sport. Of the three Olympic sliding sports, which include bobsleigh and skeleton, luge is the fastest and most dangerous. Lugers can reach speeds of 140 km per hour (87 mph). ...
Street luge is a recent innovation of the sport. It is considered an extreme sport, as well as an Olympic sport.
Lugers compete against a timer and are timed to a thousandth of a second, making luge one of the most precisely timed sports in the world." [Luge. Wikipedia]
The vector icon example "Luge" represents one of 20 symbols from the Winter sports pictograms library for the ConceptDraw PRO diagramming and vector drawing software.
The design elements library Winter sports pictograms is included in the Winter Sports solution from the Sport area of ConceptDraw Solution Park.
Luge

Design Pictorial Infographics. Design Infographics

Soccer (Football) Diagram Software
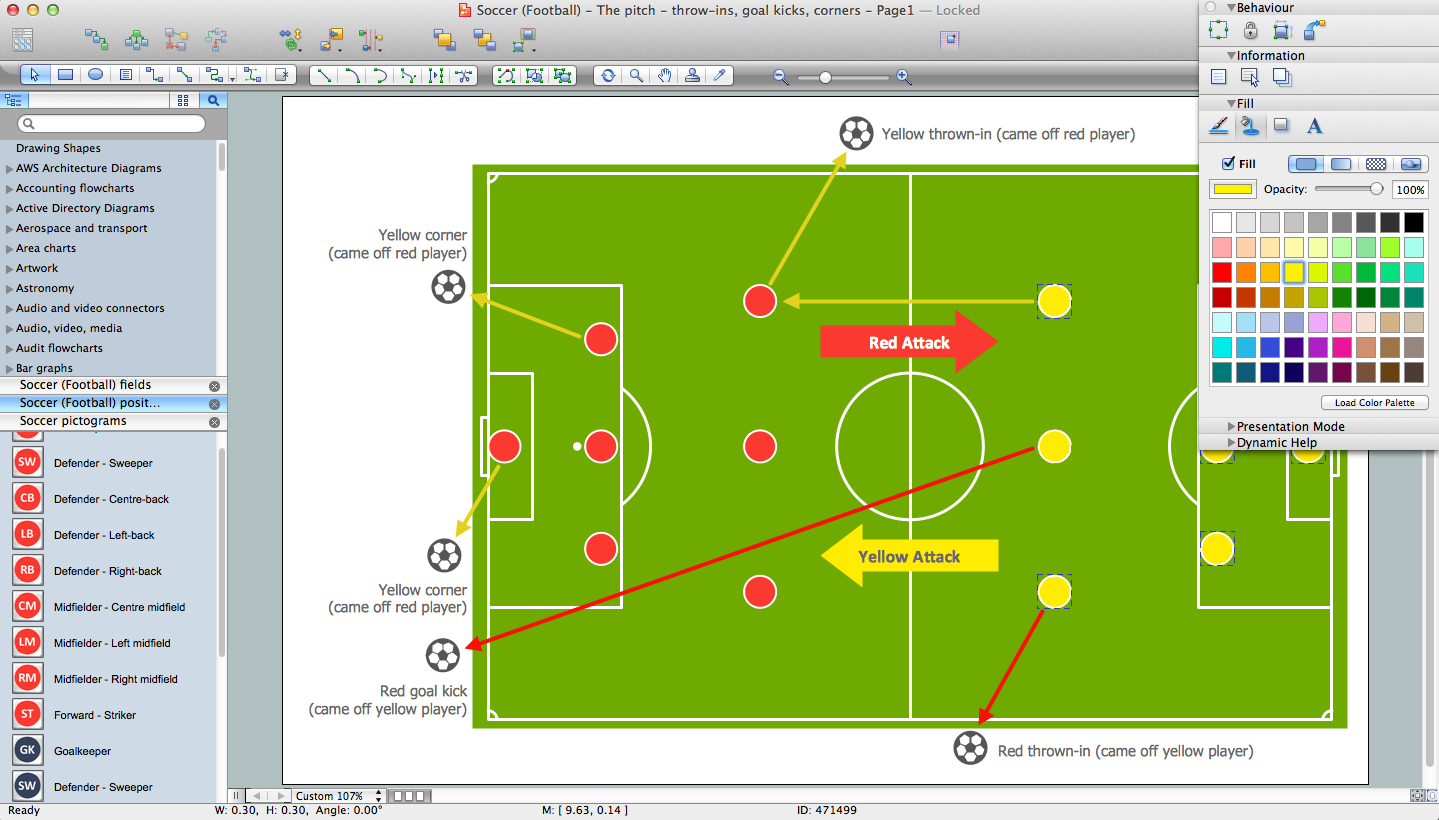
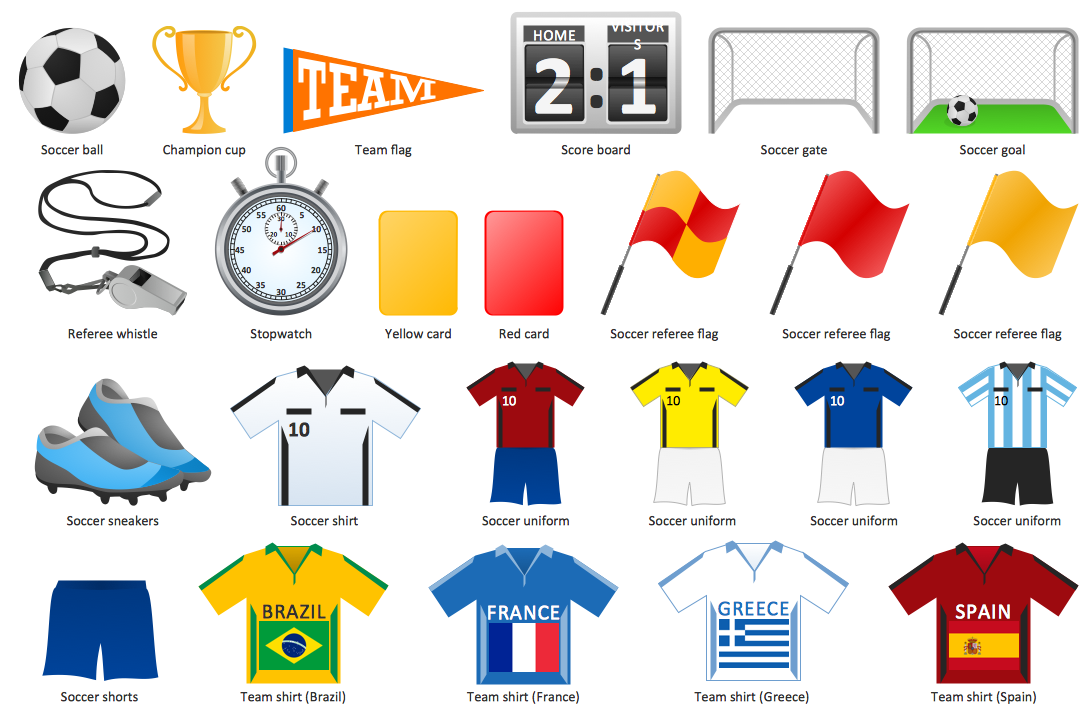
Soccer (Football) Illustrated
I Formation (Offense) Diagram
-Sample.png)
Flowchart

 Fishbone Diagrams
The Fishbone Diagrams solution extends ConceptDraw DIAGRAM software with the ability to easily draw the Fishbone Diagrams (Ishikawa Diagrams) to clearly see the cause and effect analysis and also problem solving. The vector graphic diagrams produced using this solution can be used in whitepapers, presentations, datasheets, posters, and published technical material.
 Cafe and Restaurant Floor Plans
Restaurants and cafes are popular places for recreation, relaxation, and are the scene for many impressions and memories, so their construction and design requires special attention. Restaurants must to be projected and constructed to be comfortable and e
 ConceptDraw Solution Park
ConceptDraw Solution Park collects graphic extensions, examples and learning materials
 Ice Hockey
The Ice Hockey Solution extends the capabilities of ConceptDraw DIAGRAM.5 (or later) with samples, templates, and libraries of vector objects for drawing hockey diagrams, plays schemas, and illustrations. The Ice Hockey Solution can be used to make polishe
 Computer Network Diagrams
Computer Network Diagrams solution extends ConceptDraw DIAGRAM software with samples, templates and libraries of vector icons and objects of computer network devices and network components to help you create professional-looking Computer Network Diagrams, to plan simple home networks and complex computer network configurations for large buildings, to represent their schemes in a comprehensible graphical view, to document computer networks configurations, to depict the interactions between network's components, the used protocols and topologies, to represent physical and logical network structures, to compare visually different topologies and to depict their combinations, to represent in details the network structure with help of schemes, to study and analyze the network configurations, to communicate effectively to engineers, stakeholders and end-users, to track network working and troubleshoot, if necessary.
 Chess
Chess
Chess solution extends ConceptDraw DIAGRAM application with samples, special templates and libraries of 2D and 3D elements of chessboards and chess pieces to help display any events on the chessboard, to illustrate the winning positions and chess combinations, to analyze the famous games played by prominent chess masters, to simulate gambits, to teach the audience to play chess and to demonstrate visually the chess rules, to show the variations of moves and ways of setting the checkmate to opponent in a fewest number of steps. Special template ConceptDraw DIAGRAM allows to play chess on a local network.
 Continent Maps
Continent Maps solution extends ConceptDraw DIAGRAM software with templates, samples and libraries of vector stencils for drawing the thematic maps of continents, state maps of USA and Australia.
 Australia Map
For graphic artists creating accurate maps of Australia. The Australia Map solution - allows designers to map Australia for their needs, offers a collection of scalable graphics representing the political geography of Australia, split into distinct state
 Baseball
The Baseball Solution extends ConceptDraw DIAGRAM.5 (or later) software with samples, templates, and libraries of vector objects for drawing baseball diagrams, plays, and illustrations. It can be used to make professional looking documents, presentations,
- Luge - Winter sports pictograms | Olympic Sport Symbols With Names
- Sports Pictogram Names
- Sports Pictogram With Names
- Luge - Winter sports pictograms | Soccer (Football) Diagram ...
- Winter Sport Pictogram Luge
- Nordic combined - Winter sports pictograms | Luge - Winter sports ...
- Snowboard - Winter sports pictograms | Speed skating - Winter ...
- Winter Sports . Olympic Games Illustrations. Medal Summary | Winter ...
- Winter Sports . Olympic Games Infographics. Medal Table | Winter ...
- Sport pictograms . Olympic Games | Winter Sports . Using Winter ...
- Building Drawing Software for Design Sport Fields | Design ...
- Winter Olympics pictograms - Vector stencils library | Luge - Winter ...
- Building Drawing Software for Design Sport Fields | Building ...
- Winter Sports . Using Winter Sports Design Elements Producing ...
- Luge - Winter sports pictograms | Design elements - Winter sports ...
- Winter Sports . Olympic Games Illustrations. Medal Summary | Winter ...
- Sport pictograms . Olympic Games | Speed skating - Winter sports ...
- Winter Sports . Illustrations and Visualize Statistics | Winter Sports ...
- Wheelchair curling - Winter sports pictograms | iPhone User ...
- Luge - Winter sports pictograms | Winter Olympics - Luge | Winter ...