This site uses cookies. By continuing to browse the ConceptDraw site you are agreeing to our Use of Site Cookies.

Structured Systems Analysis and Design Method. SSADM with ConceptDraw DIAGRAM

Structured Systems Analysis and Design Method (SSADM) was developed in the UK in the early 1980s and accepted in 1993 in order to analyze and project the information systems. Use the data flow diagrams (DFD) for describing the informational, functional and event-trigger models, the Logical Data Structure (LDS) diagrams for describing which data the system operates with and Entity Life History (ELH) diagrams for modelling events that happened in the system and find it simple to make any of these or other diagrams with help of our software. Starting now, you’ll definitely make a better chart tomorrow, so why not to do it now, at this very moment? Once you get used to ConceptDraw DIAGRAM , you’ll find our product to be the most smart version of any existing applications and you’ll recommend it to all those who you care for to simplify their work and their lives.

SSADM Diagram

The vector stencils library SSADM from the solution Systems engineering contains specific symbols of SSADM diagrams for ConceptDraw DIAGRAM diagramming and vector drawing software. The Systems engineering solution is contained in Software Development area of ConceptDraw Solution Park.
The example below illustrates the waterfall model used in SSADM. This model involves 5 stages of developing a product such as requirements specification and its' analysis, design, coding and testing.

JSD - Jackson system development

Jackson System Development (JSD) is a linear method of system development created by Michael A. Jackson and John Cameron in the 1980s. It comprises the whole software life cycle directly or providing a framework for more specialized techniques.
When implementing the Jackson System Development method and designing JSD diagrams, you can succesfully use the powerful and helpful tools of ConceptDraw DIAGRAM software extended with Entity-Relationship Diagram (ERD) solution from the Software Development area of ConceptDraw Solution Park.

How to Present a Social Media Response Plan DFD to Your Team

Interactive tool helps you find the appropriate response to social media mentions quickly. There are materials to help trainers and consultants develop a social media strategy and provide training for social media groups on how to effectively accomplish their daily work.

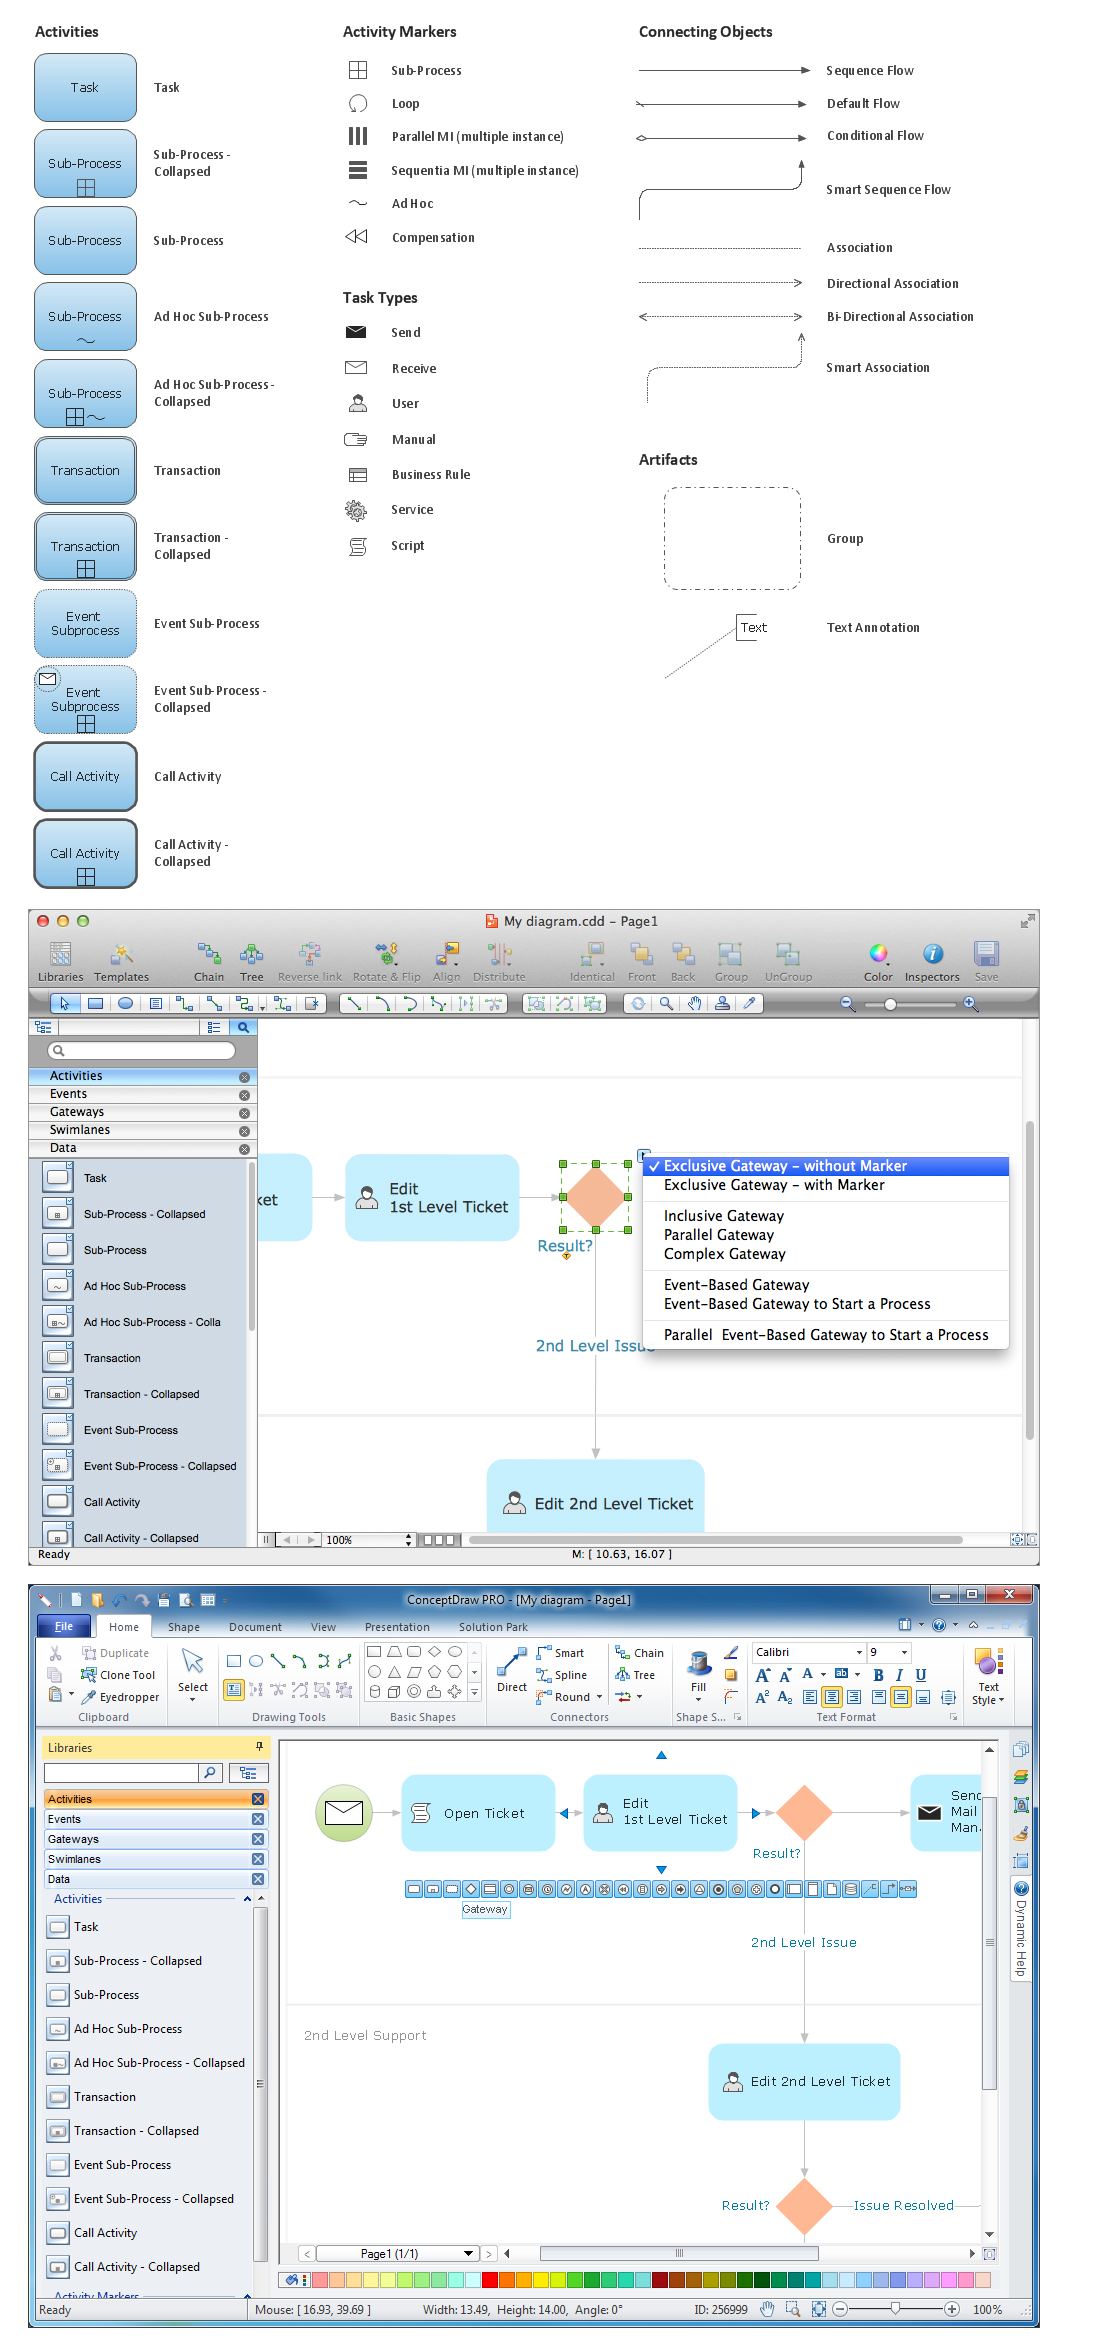
Diagramming Software for Business Process

Create professional business process diagram with ConceptDraw Activities library with 34 objects from BPMN.

Software Work Flow Process in Project Management with Diagram

This sample was created in ConceptDraw DIAGRAM diagramming and vector drawing software using the Workflow Diagrams Solution from the Software Development area of ConceptDraw Solution Park.

This sample shows the Workflow Diagram that clearly illustrates stages a BPM consists of and relations between all parts of business. The Workflow Diagrams are used to represent the transferring of data during the work process, to study and analysis the working processes, and to optimize a workflow.

Booch OOD Diagram

The vector stencils library Booch OOD from the solution Software Engineering contains specific symbols of the Booch method such as class symbols, association symbols, aggregation symbols for ConceptDraw DIAGRAM diagramming and vector drawing software. The Software Engineering solution is contained in the Software Development area of ConceptDraw Solution Park.

Draw Network Diagram based on Templates and Examples

ConceptDraw is rapid and powerful network diagram drawing software with rich examples, templates, design objects and stencils.

Gane Sarson Diagram

The vector stencils library Gane-Sarson Notation from the solution Data Flow Diagrams contains specific symbols of the Gane-Sarson notation such as process symbol, connector symbol, jump symbol for ConceptDraw DIAGRAM diagramming and vector drawing software. The Data Flow Diagrams solution is contained in the Software Development area of ConceptDraw Solution Park.

Context Diagram Template

This template shows the Context Diagram. It was created in ConceptDraw DIAGRAM diagramming and vector drawing software using the Block Diagrams Solution from the “Diagrams” area of ConceptDraw Solution Park.
The context diagram graphically identifies the system. external factors, and relations between them. It’s a high level view of the system. The context diagrams are widely used in software engineering and systems engineering for designing the systems that process the information.