 25 Typical Orgcharts
The 25 Typical Orgcharts solution contains powerful organizational structure and organizational management drawing tools, a variety of professionally designed organization chart and matrix organization structure samples, 25 templates based on various orga
Business diagrams & Org Charts with ConceptDraw DIAGRAM
The business diagrams are in great demand, they describe the business processes, business tasks and activities which are executed to achieve specific organizational and business goals, increase productivity, reduce costs and errors. They let research and better understand the business processes. ConceptDraw DIAGRAM is a powerful professional cross-platform business graphics and business flowcharting tool which contains hundreds of built-in collections of task-specific vector stencils and templates. They will help you to visualize and structure information, create various Business flowcharts, maps and diagrams with minimal efforts, and add them to your documents and presentations to make them successful. Among them are Data flow diagrams, Organization charts, Business process workflow diagrams, Audit flowcharts, Cause and Effect diagrams, IDEF business process diagrams, Cross-functional flowcharts, PERT charts, Timeline diagrams, Calendars, Marketing diagrams, Pyramids, Target diagrams, Venn diagrams, Comparison charts, Analysis charts, Dashboards, and many more. Being a cross-platform application, ConceptDraw DIAGRAM is very secure, handy, free of bloatware and one of the best alternatives to Visio for Mac users.
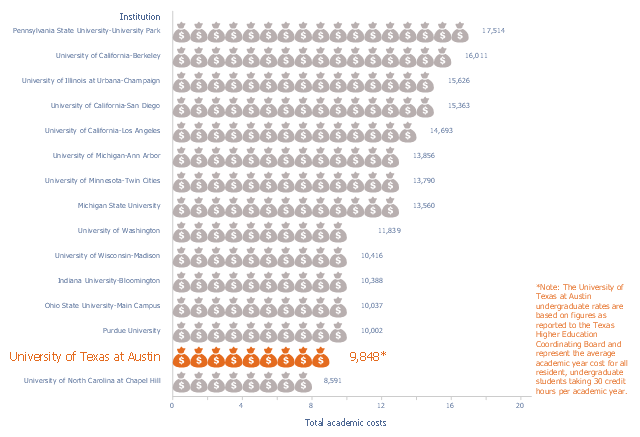
This picture bar graph sample shows the UT Austin Tuition Ranks 6th Compared to Other Texas Public Universities (Tuition and fees per semester, fall 2015). It was designed using data of the diagram "Compare UT Tuition" from the website of the University of Texas at Austin.
[tuition.utexas.edu/ compare]
The pictorial chart "Academic costs for residents, 2015-16" was created using the ConceptDraw PRO diagramming and vector drawing software extended with the Picture Graphs solution from the Graphs and Charts area of ConceptDraw Solution Park.
[tuition.utexas.edu/ compare]
The pictorial chart "Academic costs for residents, 2015-16" was created using the ConceptDraw PRO diagramming and vector drawing software extended with the Picture Graphs solution from the Graphs and Charts area of ConceptDraw Solution Park.
HelpDesk
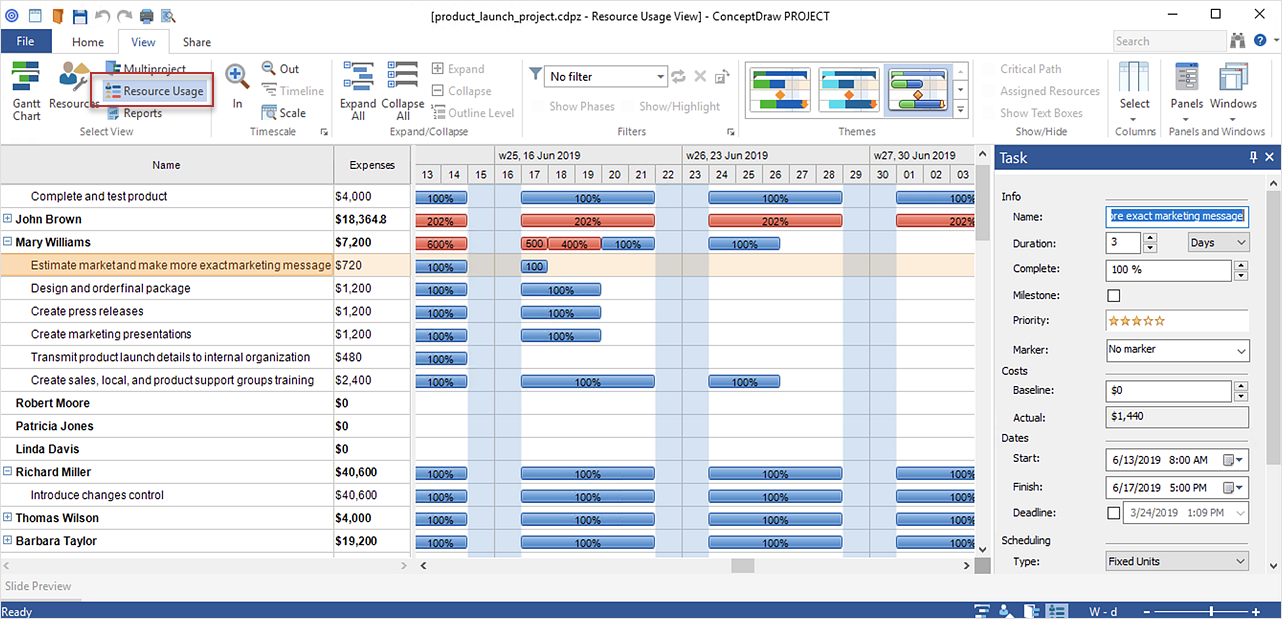
How to Plan and Allocate Resources with ConceptDraw PROJECT on PC
Effective resource management is a key factor in the successful project implementation. The common types of resources for which the project manager has an impact, include material resources (materials, energy), staff (work) and equipment. CoceptDraw PROJECT provides easy ways to project Resources Management: Create a list of project resources and assign the right human resource, as well as the necessary material, or equipment to be used.- Orgchart | Create Organizational Chart | 25 Typical Orgcharts ...
- How to Draw an Organization Chart | ConceptDraw PRO ...
- Staff Organizational Chart
- Create Organizational Chart | Orgchart | An Organogram Of A ...
- Staff Organization Chart
- Labour Required For Production Line Staff Organizational Charts
- Structure Of Waerhouse Staff
- Organizational Chart Template | Matrix Organization Structure ...
- Organizational Structure | Matrix Organization Structure | 25 Typical ...
- Organizational Structure | How to Draw an Organization Chart | How ...
- How to Draw an Organization Chart | How to Draw an ...
- Organization chart - Foodbank | How to Draw an Organization Chart ...
- How to Draw an Organization Chart | Organizational Structure ...
- Flow chart Example. Warehouse Flowchart | Organization chart ...
- Trouble ticket system - BPMN 2.0 diagram | Gant Chart in Project ...
- Projects HR dashboard | Employee distribution - HR dashboard ...
- Organogram Software | Organigrams with ConceptDraw PRO | How ...
- Diagram Of Manufacturing Staff
- Organizational Structure | ConceptDraw PRO - Organizational chart ...
- Organigrams with ConceptDraw PRO | ConceptDraw PRO ...


