This financila dashboard example was drawn on the base of the Enterprise dashboard from the Mecklenburg County Government website.
[charmeck.org/ mecklenburg/ county/ CountyManagersOffice/ OMB/ dashboards/ Pages/ Enterprise.aspx]
"In management information systems, a dashboard is "an easy to read, often single page, real-time user interface, showing a graphical presentation of the current status (snapshot) and historical trends of an organization’s key performance indicators to enable instantaneous and informed decisions to be made at a glance."
For example, a manufacturing dashboard may show key performance indicators related to productivity such as number of parts manufactured, or number of failed quality inspections per hour. Similarly, a human resources dashboard may show KPIs related to staff recruitment, retention and composition, for example number of open positions, or average days or cost per recruitment.
Types of dashboards.
Dashboard of Sustainability screen shot illustrating example dashboard layout.
Digital dashboards may be laid out to track the flows inherent in the business processes that they monitor. Graphically, users may see the high-level processes and then drill down into low level data. This level of detail is often buried deep within the corporate enterprise and otherwise unavailable to the senior executives.
Three main types of digital dashboard dominate the market today: stand alone software applications, web-browser based applications, and desktop applications also known as desktop widgets. The last are driven by a widget engine.
Specialized dashboards may track all corporate functions. Examples include human resources, recruiting, sales, operations, security, information technology, project management, customer relationship management and many more departmental dashboards.
Digital dashboard projects involve business units as the driver and the information technology department as the enabler. The success of digital dashboard projects often depends on the metrics that were chosen for monitoring. Key performance indicators, balanced scorecards, and sales performance figures are some of the content appropriate on business dashboards." [Dashboard (management information systems). Wikipedia]
The example "Enterprise dashboard" was created using the ConceptDraw PRO diagramming and vector drawing software extended with the Composition Dashboard solution from the area "What is a Dashboard" of ConceptDraw Solution Park.
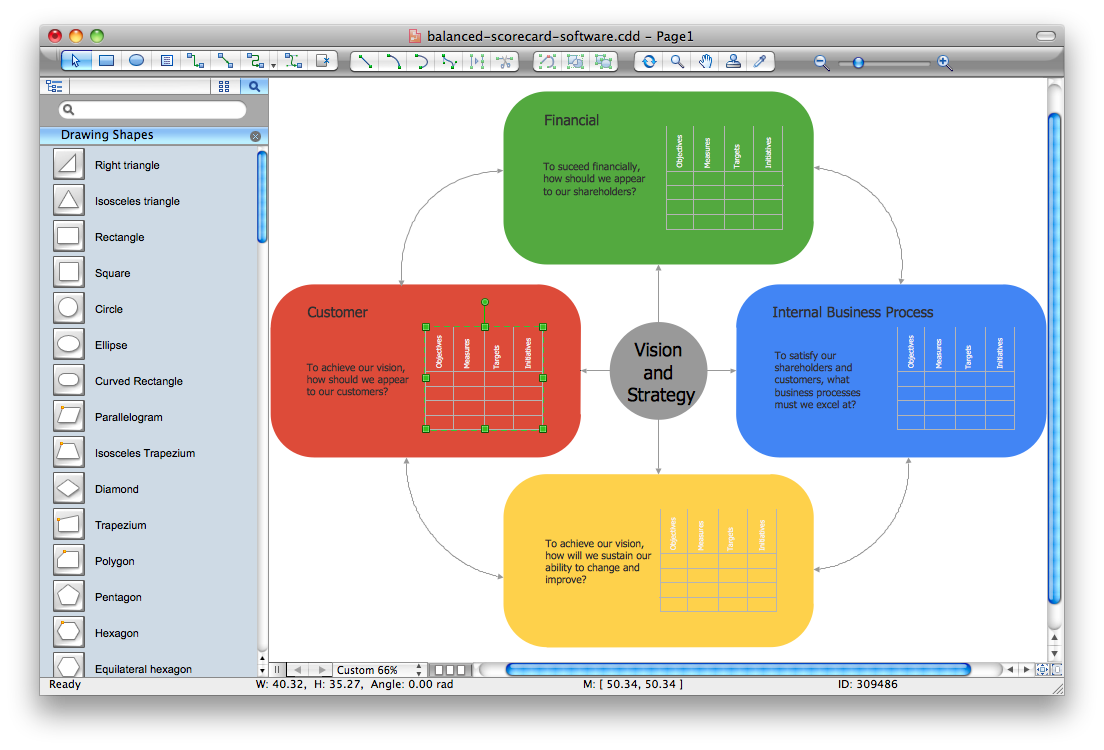
Balanced Scorecard Software
Balanced Scorecard Software provide incredible large variety of samples, templates and libraries of predesigned vector objects. Nothing could be easy that use the predesigned template and fill it, and simply drag the ready-to-use objects for designing your own balanced scorecard diagram.HelpDesk
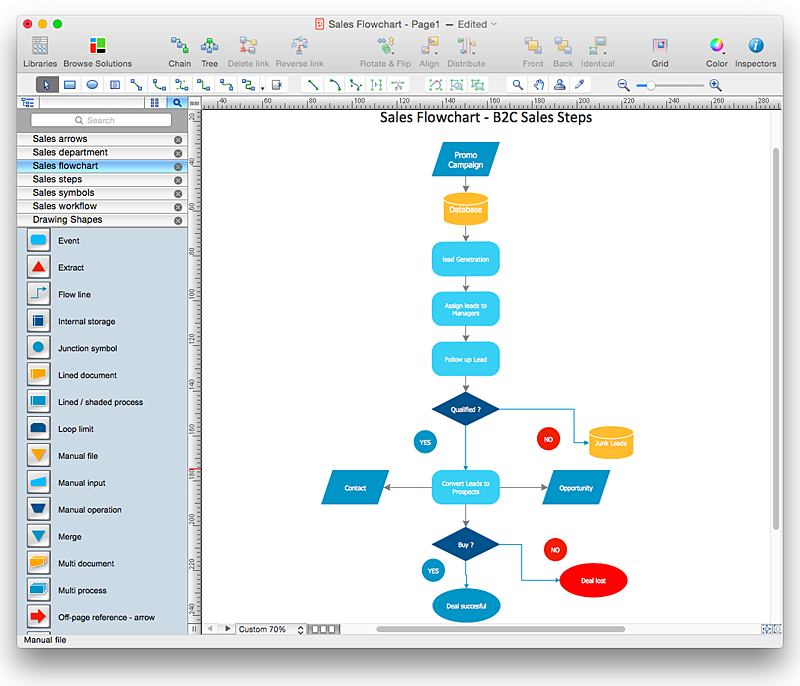
How to Create a Sales Flowchart Using ConceptDraw PRO
A Sales flowchart is a specialized type of flowchart. With the help of a sales flowchart you can visually describe tasks, documents, people responsible for execution at each stage of the sales process. For most commercial organizations, the sales process is inherent to its existence and ability to create profit. Although each company will achieve this aim in its own way, the core selling process remains similar throughout — a potential buyer or prospective customer exchanges money with an organization in return for goods or services. Despite this rather simplistic definition, there exists huge scope as to which approach is taken. Indeed, it is not uncommon for the sales division to be the largest within a corporate structure, employing a team of salespeople, analysts, and the sales managers, who are in charge of sales division operations.The practical applications of sales process flowcharts are numerous and wide ranging. At sales level, you might map the process of customer interactHelpDesk
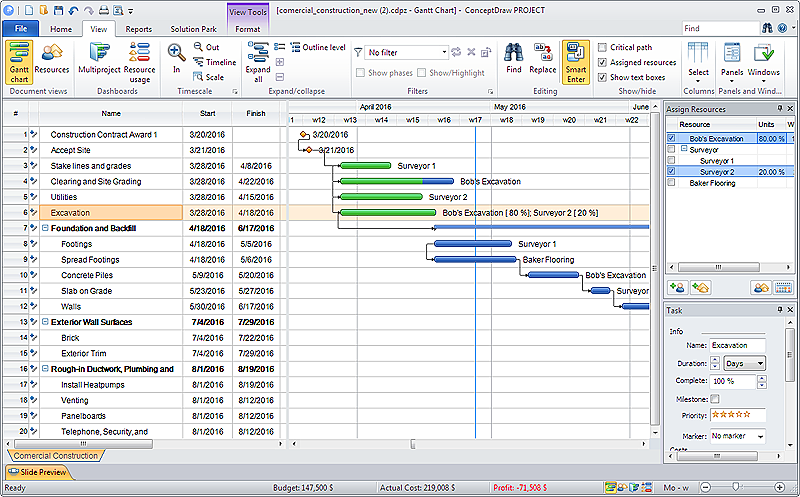
How to Plan and Allocate Resources in Your Project with ConceptDraw PROJECT for Windows
Effective resource management is a key factor in the successful project implementation. The common types of resources for which the project manager has an impact, include material resources (materials, energy), staff (work) and equipment. CoceptDraw PROJECT provides easy ways to project Resources Management: Create a list of project resources and assign the right human resource, as well as the necessary material, or equipment to be used.HelpDesk
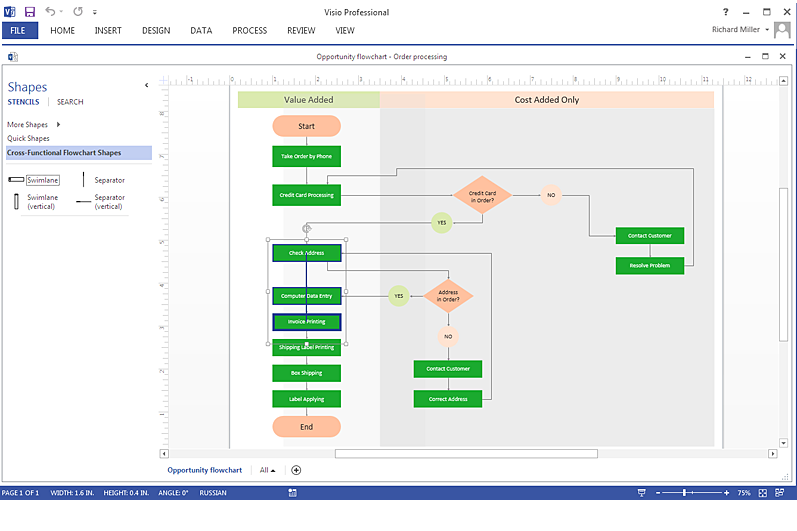
How To Create a MS Visio Cross-Functional Flowchart Using ConceptDraw PRO
Cross-functional is a process involving several functional layers. Such processes typically cause the most problems, and therefore, is the most potential for improvement. Cross-functional business processes are usually illustrate the processes of product development, commercial proposal development, the order execution process - everything, that involves several departments. The package of possible improvements - is the task of re-engineering. To illustrate the cross-functional processes often use cross-functional flowchart is often used to illustrate the cross-functional processes. ConceptDraw PRO allows you to easily create cross-functional flowchart. Then, you can export it to MS Visio VSDX or VDX format and successfully share it with your colleagues still using MS Visio.HelpDesk
How To Create Root Cause Analysis Diagram Using ConceptDraw Office
Root Cause Analysis (RCA) is used to determine the main causes of the problem. If the certain factor is the root cause, this mean that its vanishing will help to prevent the further recurrence of the problem. Root Cause Analysis diagram is used to analyze the root causes of factors that influence the problem. It helps to identify the root causes for a factor and then propose possible corrective actions. A diagram is constructed separately for each high priority factor. The ability to create a RCA tree diagram from a mind map is supported by the ConceptDraw Seven Management and Planning Tools solution.HelpDesk
How to Create a Plant Layout Design
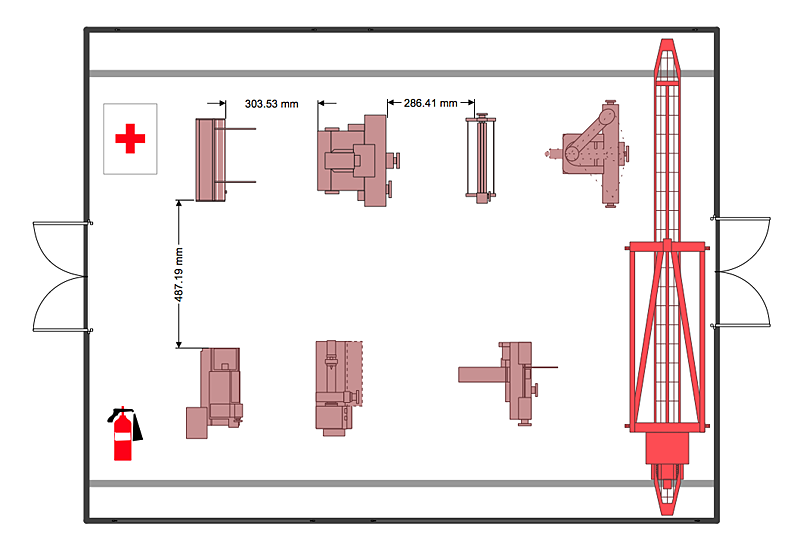
A plant construction process begins from a plant layout stage - an engineering stage used to design, analyze and finally choose the suitable configurations for a manufacturing plant. Plant Layout issues are core to any enterprise and are challenged in all types of manufacturing process. The sufficiency of layout influences the efficiency of subsequent operations. It is an important background for efficient manufacturing and also has a great deal with many questions. Once the place of the plant has been determined, the next important task before the management of the plant is to plan appropriate layout for the enterprise. Plant layout is used to create the most effective physical arrangement of machinery and equipment, with the plant building in such a manner so as to make quickest and cheapest way from a raw material to the shipment of the completed product Making a plan that shows the location of industrial equipment involves many different elements that can be managed using ConProject —Task Trees and Dependencies
Users new to ConceptDraw PROJECT will find the Basic lessons an essential platform for familiarizing themselves with the program′s functions. This video lesson will teach you how to set up task trees and dependencies.ConceptDraw PRO: Able to Leap Tall Buildings in a Single Bound
ConceptDraw PRO is the world’s premier cross-platform business-diagramming tool. Many, who are looking for an alternative to Visio, are pleasantly surprised with how well they can integrate ConceptDraw PRO into their existing processes. With tens of thousands of template objects, and an easy method for importing vital custom objects from existing Visio documents, ConceptDraw PRO is a powerful tool for making extremely detailed diagrams, quickly and easily.HelpDesk
How to Create a Stakeholder Onion Diagram Using ConceptDraw PRO
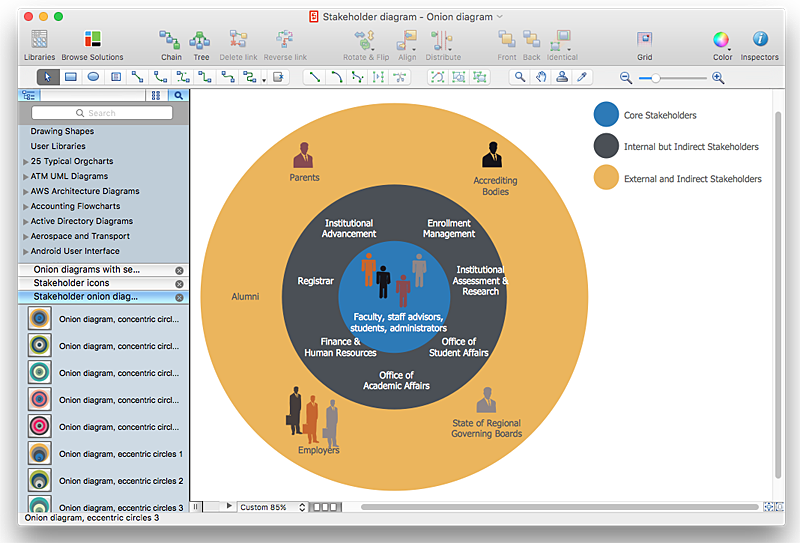
The Stakeholder Onion Diagram is stakeholder analysis tool from the arsenal of project management. It is used to display the relationships of stakeholders to a project goal. An Onion Diagram shows how the stakeholder activities affect the project results. The ConceptDraw Stakeholder Onion Diagram solution is intended to depict how the relationships that subsists in a project environment can influence on a project. A set of libraries and objects provided by this solution make ashort work of visualizing the stakeholder analysis of a project.HelpDesk
How to Create a Bubble Diagram Using ConceptDraw PRO
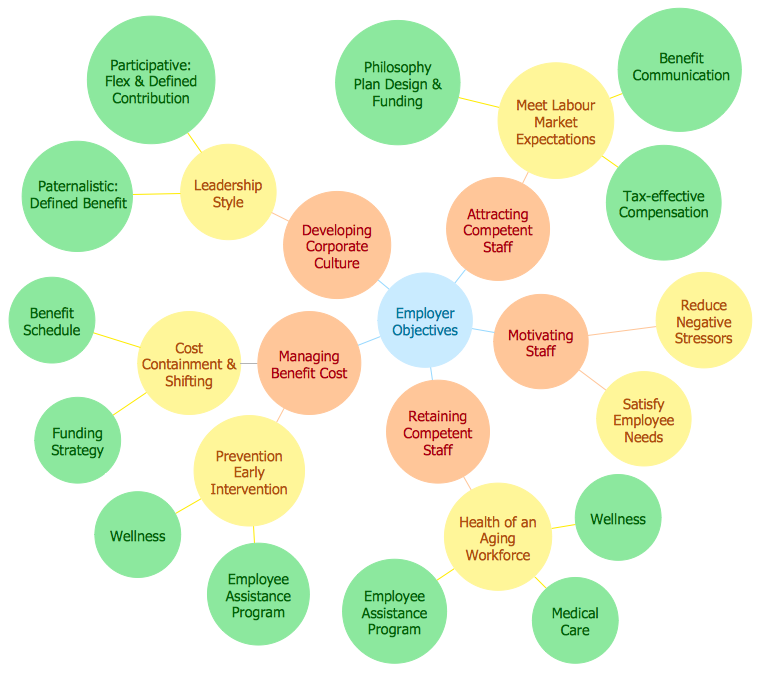
Bubble Diagram is a simple chart that consists of circles (bubbles) repesening certain topics or processes. Bubbles are connected by lines depicting the type of relationships between the bubbles. The size of each bubble is depended on the importance of the entity it represents. Bubble charts are widely used throughout social, economical, medical, and other scientific researches as well as throughout architecture and business management. Bubble charts are often used during the early stages of product development to visualize thoughts and ideas for the purpose of sketching out a development plan. ConceptDraw PRO allows you to draw a bubble diagrams using the Bubble Diagrams solution.
 Seven Management and Planning Tools
Seven Management and Planning Tools solution extends ConceptDraw PRO and ConceptDraw MINDMAP with features, templates, samples and libraries of vector stencils for drawing management mind maps and diagrams.
HelpDesk
How to Create and Customize a Calendar in ConceptDraw PRO
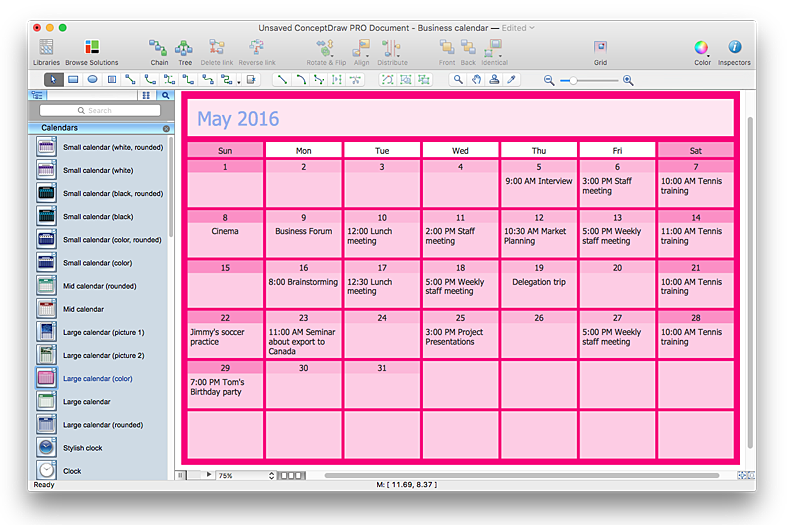
ConceptDraw PRO has a large selection of various shapes, objects and clip-arts. It also has a tool that helps you find exactly what you need. ConceptDraw PRO has calendar objects available, and it’s very easy to customize it and set your dates. The ability to create a custom calendars is delivered by the Calendars solution. With the help of ConceptDraw PRO you can create a calendar that helps you plan your day / week / month and do not forget about the important things in life. For any day in your custom calendar, you can create a task list and add hyperlinks to a relevant information.
Video Lessons
 Stakeholder Onion Diagrams
The Stakeholder Onion Diagram is often used as a way to view the relationships of stakeholders to a project goal. A basic Onion Diagram contains a rich information. It shows significance of stakeholders that will have has influence to the success achieve
- Enterprise dashboard | KPI Dashboard | HR Flowcharts | Human ...
- Staff Performance Dashboard
- Performance Indicators | Sales Dashboard | Constant improvement ...
- Employee distribution - HR dashboard | How to Create a HR ...
- Performance Indicators | KPI Dashboard | Dashboard | Key ...
- KPI Dashboard | Enterprise dashboard | Visualize Sales Data Using ...
- Employee distribution - HR dashboard | Projects HR dashboard | HR ...
- Performance Indicators | What is a KPI ? | KPI Dashboard | Key ...
- Performance Indicators | KPI Dashboard | What is a KPI ? | Key ...
- PM Dashboards | How to Create a Sales Dashboard Using ...
- Enterprise dashboard | KPI Dashboard | Business Graphics ...
- Enterprise dashboard | KPI Dashboard | Business Intelligence ...
- Performance Indicators | What is a KPI ? | KPI Dashboard | Sales ...
- KPI Dashboard | Enterprise dashboard | Business Graphics ...
- Employee Kpi Dashboard
- Recruitment Kpi Dashboard
- The Facts and KPIs | Performance Indicators | Constant ...
- Enterprise dashboard | Design elements - Meter indicators ...
- Performance Indicators | Design elements - Sales KPIs and metrics ...
- Performance Indicators | Enterprise dashboard | Design elements ...

