 Computer Network Diagrams
Computer Network Diagrams solution extends ConceptDraw PRO software with samples, templates and libraries of vector icons and objects of computer network devices and network components to help you create professional-looking Computer Network Diagrams, to plan simple home networks and complex computer network configurations for large buildings, to represent their schemes in a comprehensible graphical view, to document computer networks configurations, to depict the interactions between network's components, the used protocols and topologies, to represent physical and logical network structures, to compare visually different topologies and to depict their combinations, to represent in details the network structure with help of schemes, to study and analyze the network configurations, to communicate effectively to engineers, stakeholders and end-users, to track network working and troubleshoot, if necessary.
 Cross-Functional Flowcharts
Cross-functional flowcharts are powerful and useful tool for visualizing and analyzing complex business processes which requires involvement of multiple people, teams or even departments. They let clearly represent a sequence of the process steps, the order of operations, relationships between processes and responsible functional units (such as departments or positions).
HelpDesk
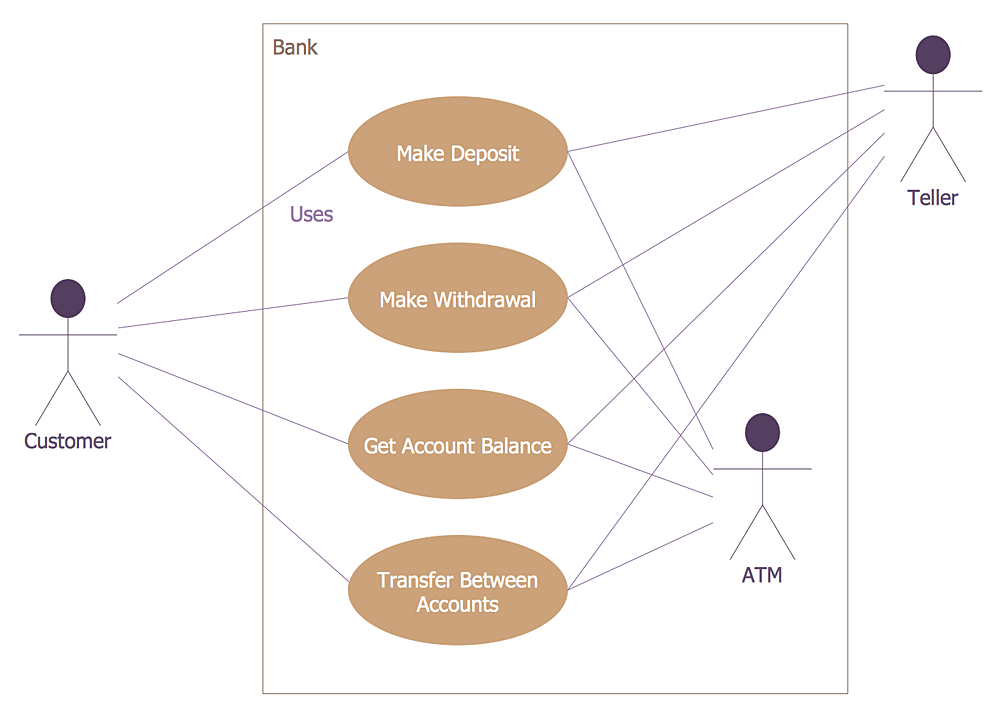
How to Create a Bank ATM Use Case Diagram
UML diagrams are often used in banking management for documenting a banking system. In particular, the interaction of bank customers with an automated teller machine (ATM) can be represented in a Use Case diagram. Before the software code for an ATM, or any other system design, is written, it is necessary to create a visual representation of any object-oriented processes. This is done most effectively by creating a Unified Modeling Language (UML) diagram, using object-oriented modeling. UML works as a general purpose modeling language for software engineers or system analysts, offering a number of different diagram styles with which to visually depict all aspects of a software system. ConceptDraw PRO diagramming software, enhanced and expanded with the ATM UML Diagrams solution, offers the full range of icons, templates and design elements needed to faithfully represent ATM and banking information system architecture using UML standards. The ATM UML Diagrams solution is useful for beginner and advanced users alike. More experienced users will appreciate a full range of vector stencil libraries and ConceptDraw PRO's powerful software, that allows you to create your ATM UML diagram in a matter of moments.
 Cisco Network Diagrams
Cisco Network Diagrams solution extends ConceptDraw PRO software with samples, templates and libraries of vector stencils for drawing the Cisco computer network diagrams.
 Entity-Relationship Diagram (ERD)
Entity-Relationship Diagram (ERD) solution extends ConceptDraw PRO software with templates, samples and libraries of vector stencils from drawing the ER-diagrams by Chen's and crow’s foot notations.
How To Create Professional Diagrams
No need for any special drawing skills to create professional looking diagrams outside of your knowledge base. ConceptDraw PRO takes care of the technical side. Use templates, samples and special libraries for your needs.- Sample Network Diagram For Banks
- How Bank Communication Flow Through Chart
- Communication Flow In A Bank
- Diagram Computer Networks Banking
- Schematics Of A Standard Bank
- Flow Chart Of Different Types Of Banks
- Computer Network Diagrams | UML Diagram | How to Create a Bank ...
- Basic Bank Network Diagram
- Affinity Diagram | Computer and Networks Area | Business Process ...
- Computer Network Diagrams | Process Flowchart | Local area ...
- Draw The Communication Expanded Chart
- Mode Of Communication Diagram Of Organisational Behavior
- Process Flowchart | Computer Network Diagrams | Interactive Voice ...
- Access Bank Organizational Chart Drawing
- Each Department Of Bank Show Flow Chart
- Level Of Communication Chart
- Draw New Organization Chart To Show The Expanded
- Flow Of Communication Through Chart
- Draw A Diagram To Explain Communication In Your Department

