DroidDia prime
Droiddia allows you to make flow charts org charts venn diagrams mindmaps and do other diagrams with no constrains and as little effort as possible.HelpDesk
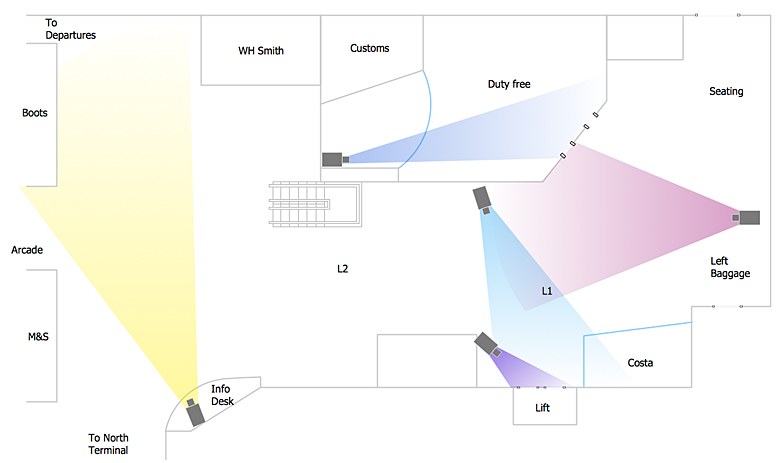
How to Create a CCTV Diagram in ConceptDraw PRO
CCTV (Closed circuit television) diagram is used to depict a system of video monitoring. The CCTV diagram provides video cameras placement strategy. CCTV diagram should include the scheme of strategic placement of video cameras, which capture and transmit videos to either a private network of monitors for real-time viewing, or to a video recorder for later reference. CCTV is commonly used for surveillance and security purposes. Using ConceptDraw PRO with the Security and Access Plans Solution lets you create professional looking video surveillance CCTV system plans, security plans, and access schemes.HelpDesk
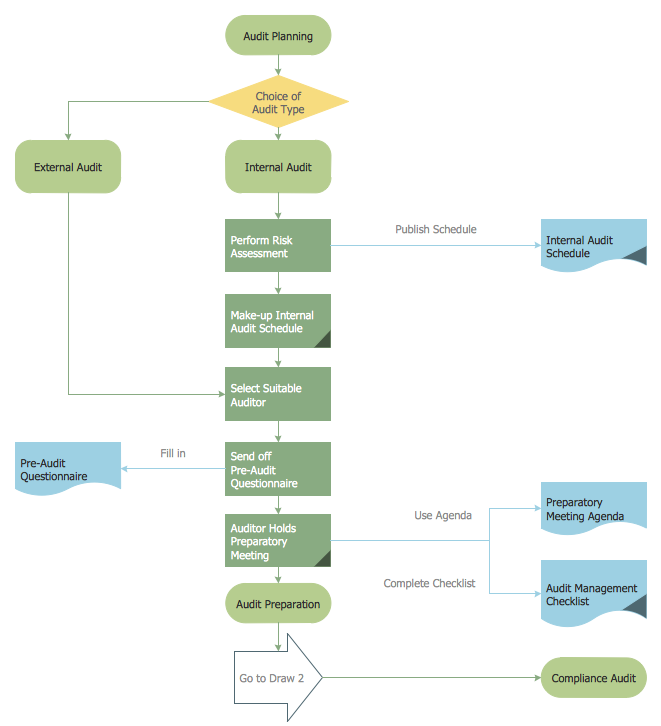
How to Create an Audit Flowchart Using ConceptDraw PRO
Audit flowcharts are often used in auditors activity. This is the most effective way of preparation and documentation of the audit process. Financial audit process has a clear structure, and therefore audit flowchart is often used to denote an audit process. This is the most effective way of preparation and documentation of the audit process. Flowcharts are often used in auditors activity. A flowchart may be created at any stage of an audit process as an aid in the determination and evaluation of a client's accounting system. ConceptDraw PRO allows you to create professional accounting flowchart quickly using the professional Audit Flowcharts solution.HelpDesk
How to Connect Text Data to a Time Series Chart on Your Live Dashboard
Time Series Dashboard means an integration of some type of diagrams: Line Charts, Bar Charts, Column Charts, and Dot Plots on a single space. The ConceptDraw Time Series Dashboard solution can be used to create the interactive Time Series dashboard. The libraries of Time Series Charts solution contain the Live Objects, that can change their appearance depending on the external data. Each chart from the Time Series dashboard displays particular source data. You can include Time Series Charts in your business or technical dashboards to show and compare the items changing over time.
HelpDesk
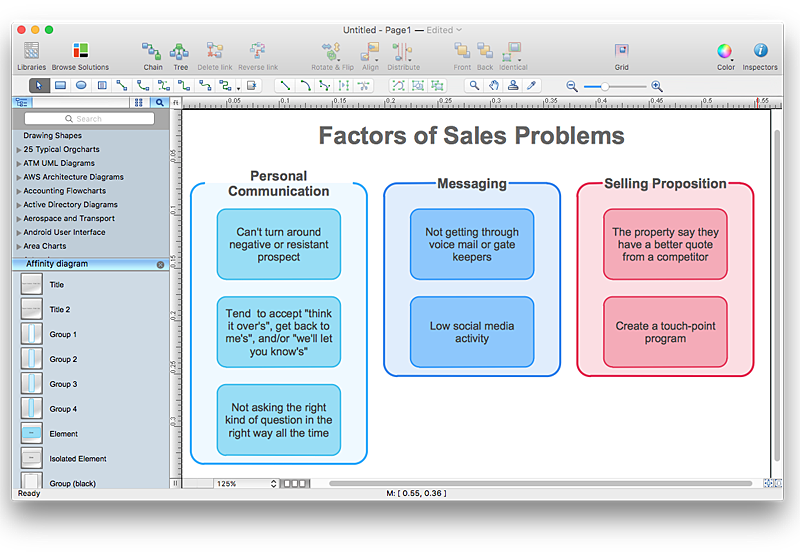
How To Create an Affinity Diagram Using ConceptDraw Office
Affinity diagram is designed to prepare the data for further analysis of the cause-effect relationships.The Affinity diagram shows the structure of large, complex factors that have an influence on a problem, and then divides them up into a smaller and simpler structure. We recommend using a mind map for Brainstorming and collecting the factors affecting the problem. The ability to create an Affinity diagram from a mind map is supported by the ConceptDraw Seven Management and Planning Tools solution.- Standard Symbols For Floor Layout In Site Preparation
- Standard Symbols To Create Design Elements In Site Preparation ...
- Draw Standard Symbols To Create Floor Layout In Site Preparation ...
- Standard Symbols For Creating Design Elements In Site Preparation
- Draw And Label At Standard Symbols To Create Floor Layout In Site ...
- 20 Standard Symbols For Floor Layout In Site Preparation For
- Standard Symbols For Site Preparation
- How To use House Electrical Plan Software | Electrical Drawing ...
- Drawings Of Fire Plans
- How to Create a Floor Plan Using ConceptDraw PRO | How to ...
- Lighting and switch layout | Lighting and switch layout | Electrical ...
- How to Draw a Floor Plan for SPA in ConceptDraw PRO | How to ...
- Network Layout Floor Plans | Design elements - Network layout ...
- Chemical and Process Engineering | Basic Flowchart Symbols and ...
- How To use House Electrical Plan Software | Cafe electrical floor ...
- Electrical Drawing Symbols In Floor Plan With Definitions
- How To Create Emergency Plans and Fire Evacuation | Fire Exit ...
- Emergency Plan | Fire and Emergency Plans | How to Draw an ...
- How To Create Restaurant Floor Plan in Minutes | Electrical and ...
- How to Draw a Floor Plan for Your Office | Business diagrams & Org ...
.jpg)


