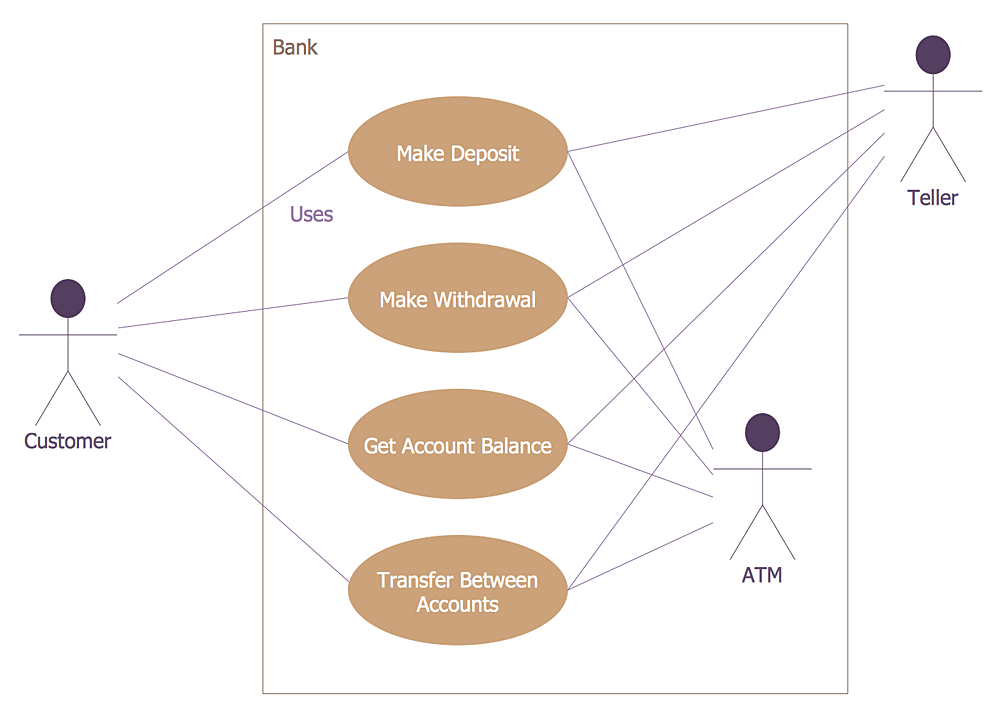
 ATM UML Diagrams
The ATM UML Diagrams solution lets you create ATM solutions and UML examples. Use ConceptDraw PRO as a UML diagram creator to visualize a banking system.
 Interactive Voice Response Diagrams
Interactive Voice Response Diagrams solution extends ConceptDraw PRO v10 software with samples, templates and libraries of ready-to-use vector stencils that help create Interactive Voice Response (IVR) diagrams illustrating in details a work of interactive voice response system, the IVR system’s logical and physical structure, Voice-over-Internet Protocol (VoIP) diagrams, and Action VoIP diagrams with representing voice actions on them, to visualize how the computers interact with callers through voice recognition and dual-tone multi-frequency signaling (DTMF) keypad inputs.
HelpDesk
How to Create a Bank ATM Use Case Diagram
UML diagrams are often used in banking management for documenting a banking system. In particular, the interaction of bank customers with an automated teller machine (ATM) can be represented in a Use Case diagram. Before the software code for an ATM, or any other system design, is written, it is necessary to create a visual representation of any object-oriented processes. This is done most effectively by creating a Unified Modeling Language (UML) diagram, using object-oriented modeling. UML works as a general purpose modeling language for software engineers or system analysts, offering a number of different diagram styles with which to visually depict all aspects of a software system. ConceptDraw PRO diagramming software, enhanced and expanded with the ATM UML Diagrams solution, offers the full range of icons, templates and design elements needed to faithfully represent ATM and banking information system architecture using UML standards. The ATM UML Diagrams solution is useful for beginner and advanced users alike. More experienced users will appreciate a full range of vector stencil libraries and ConceptDraw PRO's powerful software, that allows you to create your ATM UML diagram in a matter of moments.
 Event-driven Process Chain Diagrams
Event-driven Process Chain (EPC) Diagram is a type of flowchart widely used for modeling in business engineering and reengineering, business process improvement, and analysis. EPC method was developed within the Architecture of Integrated Information Systems (ARIS) framework.
- State Chart Diagram For Banking System
- State Diagram Bank Management System
- State Chart Diagram Of Login Process Of Online Banking System
- State Chart Diagram For Bank
- State Chart Diagram For Online Banking System
- Statechart Diagram For Bank Management System
- State Chart Diagrams For Bank Management System
- Statechart Banking
- State Chart Diagram For Atm System In Software Engineering
- State Chart Diagram Of Atm System
- Atm State Chart Diagram
- Statechart Graphic Notation
- UML Diagram | Banking System | ATM UML Diagrams | State Chart ...
- State Chart Diagram Of Online Banking System
- State Chart Diagram For Online Shopping System
- State Chart For Banking Application
- Behavioral Or State Diagram For Bank Management
- State Machine Diagram | Design elements - Bank UML state ...
- Statechart Diagram For Online Banking System
- Statechart Diagram Of Restaurant Management System
