Export from ConceptDraw PRO Document to a Graphic File
Now it’s easy to share your visual documents with other people in a form most convenient for them. ConceptDraw PRO can save your drawings and diagrams in a number of highly useful formats, including graphic files. You can save your drawing as a .PNG, .JPG, or other graphic format file.
 Divided Bar Diagrams
The Divided Bar Diagrams Solution extends the capabilities of ConceptDraw PRO v10 with templates, samples, and a library of vector stencils for drawing high impact and professional Divided Bar Diagrams and Graphs, Bar Diagram Math, and Stacked Graph.
Sample Pictorial Chart. Sample Infographics
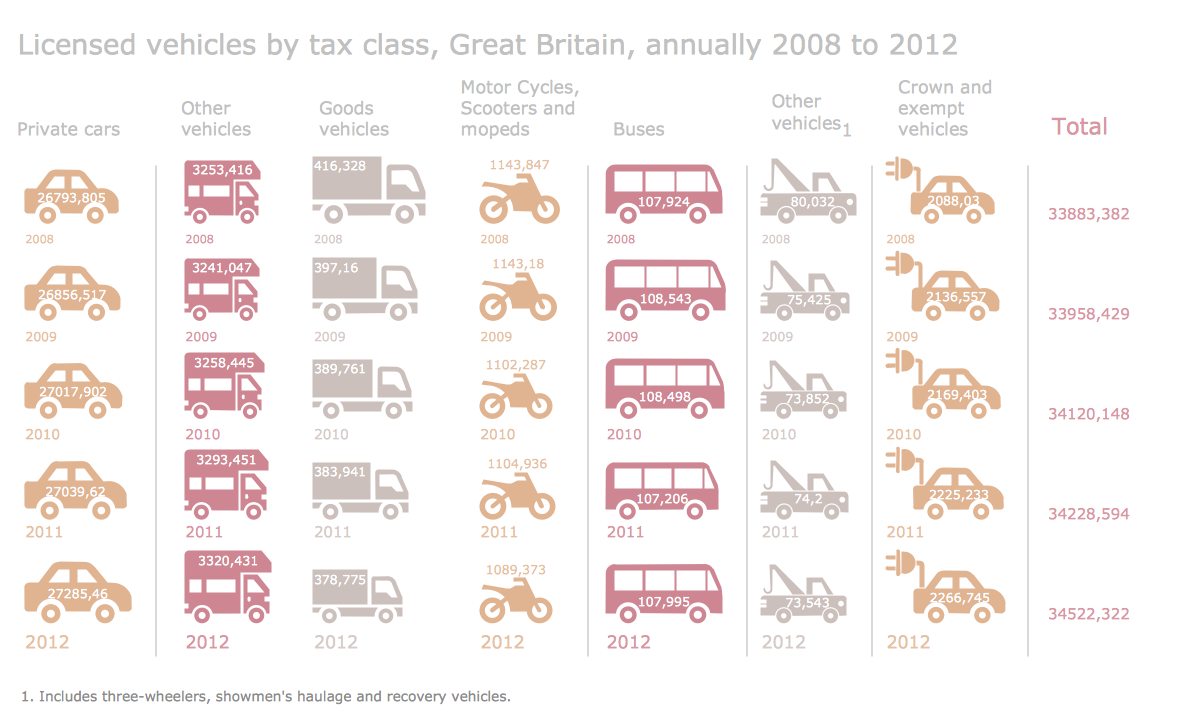
Sample Pictorial Chart - Pictorial Infographics solution provides easy-to-use design infographics drawing tools, large collection of different sample infographics and infograms, sample pictorial chart and templates to be filled in, and 10 libraries with great quantity of predesigned vector pictograms. Use Pictorial Infographics solution to draw your own design pictorial infographics documents quick and easy.The vector stencils library "Workflow management" contains 22 icons.
Use it to design your business process workflow diagrams with ConceptDraw PRO software.
"Management in businesses and organizations is the function that coordinates the efforts of people to accomplish goals and objectives by using available resources efficiently and effectively.
Management includes planning, organizing, staffing, leading or directing, and controlling an organization to accomplish the goal or target. Resourcing encompasses the deployment and manipulation of human resources, financial resources, technological resources, and natural resources." [Management. Wikipedia]
The icons example "Design elements - Workflow management" is included in the Business Process Workflow Diagrams solution from the Business Processes area of ConceptDraw Solution Park.
Venn Diagram Examples
ConceptDraw PRO diagramming and vector drawing software extended with Venn Diagrams solution from "What is a Diagram" area offers a wide set of professionally designed Venn Diagram examples which can become the good start and beautiful source of inspiration for your own Venn Diagrams.The vector stencils library "Data" contains 20 computer data icons. Use it to design your computer and telecom illustrations and infographics with ConceptDraw PRO diagramming and vector drawing software.
"Data is any sequence of one or more symbols given meaning by specific act(s) of interpretation.
Data (or datum – a single unit of data) is not information. Data requires interpretation to become information. To translate data to information, there must be several known factors considered. The factors involved are determined by the creator of the data and the desired information. ...
Digital data is data that is represented using the binary number system of ones (1) and zeros (0)." [Data (computing). Wikipedia]
The digital data icons example "Design elements - Data" is included in the Computers and Communications solution from the Illustration area of ConceptDraw Solution Park.
 Pie Charts
Pie Charts are extensively used in statistics and business for explaining data and work results, in mass media for comparison (i.e. to visualize the percentage for the parts of one total), and in many other fields. The Pie Charts solution for ConceptDraw PRO v10 offers powerful drawing tools, varied templates, samples, and a library of vector stencils for simple construction and design of Pie Charts, Donut Chart, and Pie Graph Worksheets.
UML Class Diagram Constructor
UML Class Diagrams is a type of static structure diagram that is used both for general conceptual modeling of the systematics of the application, and for detailed modeling translating the models into programming code. It describes the structure of a system by showing the: classes of a system, attributes, operations, and the relationships between them. The Rapid UML Solution for ConceptDraw PRO includes the UML Class Diagram library that helps you to design the UML Class Diagram quick and easy. You can simply and quickly drop the ready-to-use objects from the library into your document to create the UML Class Diagram.How to Draw Pictorial Chart. How to Use Infograms
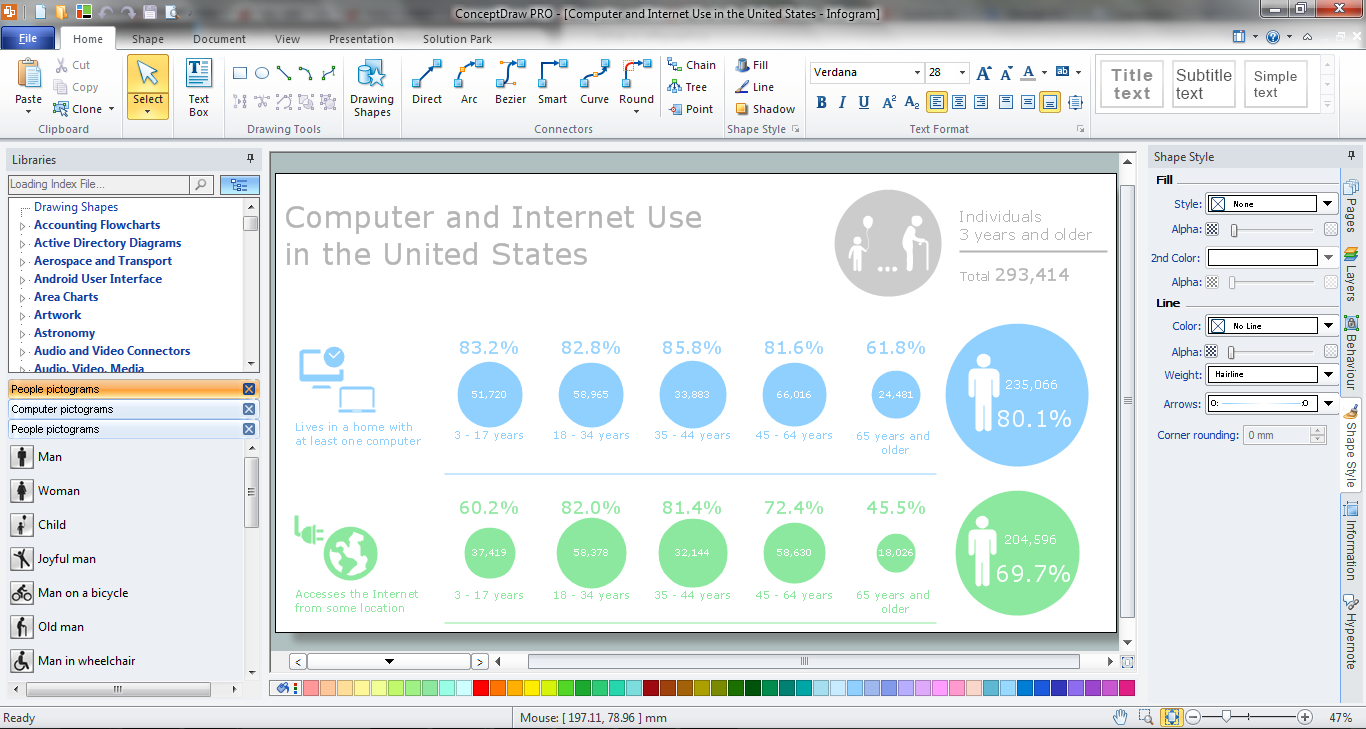
How to draw pictorial chart quick, easy and effective? ConceptDraw PRO offers the unique Pictorial Infographics Solution that will help you! Pictorial Infographics solution contains large number of libraries with variety of predesigned vector pictograms that allows you design infographics in minutes. There are available 10 libraries with 197 vector pictograms.Pie Chart Examples and Templates
A pie chart or a circle graph is a circular chart divided into sectors, illustrating numerical proportion. In a pie chart, the arc length of each sector and consequently its central angle and area, is proportional to the quantity it represents. Pie chart examples and templates created using ConceptDraw PRO software helps you get closer with pie charts and find pie chart examples suite your needs.Pie Chart Software
A pie chart is a circular diagram showing a set of data divided into proportional slices. There are several variations of this chart such as donut chart, exploded pie chart, multi-level pie charts. Although it is not very informative when a ring chart or circle chart has many sections, so choosing a low number of data points is quite important for a useful pie chart. ConceptDraw PRO software with Pie Charts solution helps to create pie and donut charts for effective displaying proportions in statistics, business and mass media for composition comparison, i.e. for visualization of part percentage inside one total.Infographic Software
ConceptDraw PRO extended with Pictorial Infographics Solution from the “What are Infographics” Area is a powerful Infographic Software. Make sure in it right now!Information Graphics
Creating of professional looking Information Graphics was always been a complex process. But now it's easier than ever thanks to the ConceptDraw PRO diagramming and vector drawing software extended with Pictorial Infographics Solution from the “What are Infographics” Area.The vector stencils library "Business" contains 24 business icons.
Use it to design your business and finance illustrations and infographics with ConceptDraw PRO diagramming and vector drawing software.
The vector stencils library "Business" is included in the Business and Finance solution from the Illustration area of ConceptDraw Solution Park.
Use it to design your business and finance illustrations and infographics with ConceptDraw PRO diagramming and vector drawing software.
The vector stencils library "Business" is included in the Business and Finance solution from the Illustration area of ConceptDraw Solution Park.
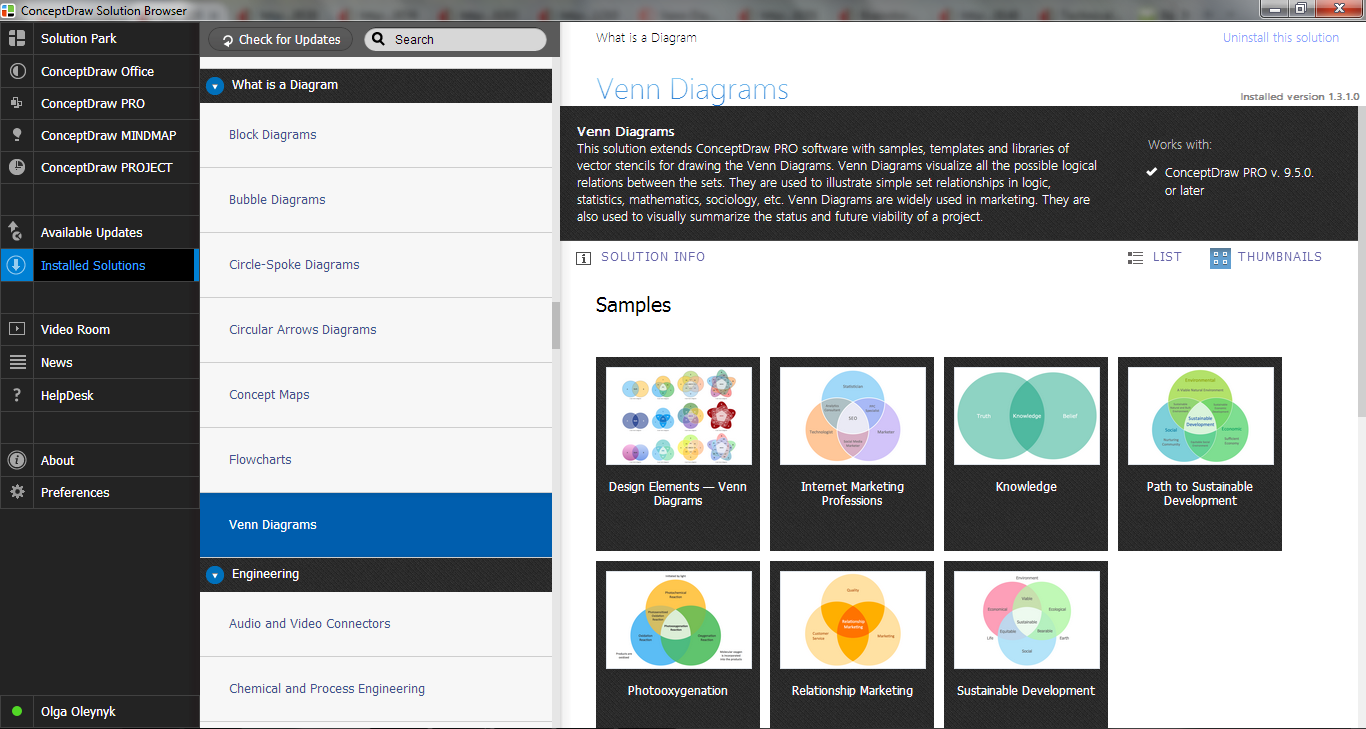
Venn Diagram Examples for Problem Solving. Environmental Social Science. Human Sustainability Confluence
The Venn diagram example below shows sustainable development at the confluence of three constituent parts. Create your Venn diagrams for problem solving in environmental social science using the ConceptDraw PRO diagramming and vector drawing software extended with the Venn Diagrams solution from the area "What is a Diagram" of ConceptDraw Solution Park.- Exchange Money Png Vector
- Flowchart design. Flowchart symbols, shapes, stencils and icons ...
- Mobile and Phones - Vector stencils library | App icons - Vector ...
- Flowchart design. Flowchart symbols, shapes, stencils and icons ...
- Dna Vector Png
- Cash Vector Png
- Business Vector Png
- Arrow Menu Png
- Design elements - Workflow management | How to Create a Pie ...
- Debt Png
- Percent Png
- Bank Branch Icon Png
- Chart Templates | Pie Charts | Chart Examples | Percentage Chart Png
- Time Series Graph Png
- Internet Circle Logo Blue Png
- Internet marketing professions | HR professions - Vector stencils ...
- Chart Pie Png
- North Arrow Icon Png
- Video Disk Png
- Png Money Vector


