Map Infographic Creator
Follow samples and map templates to create nfographic maps. It's super-easy!Map Infographic Maker
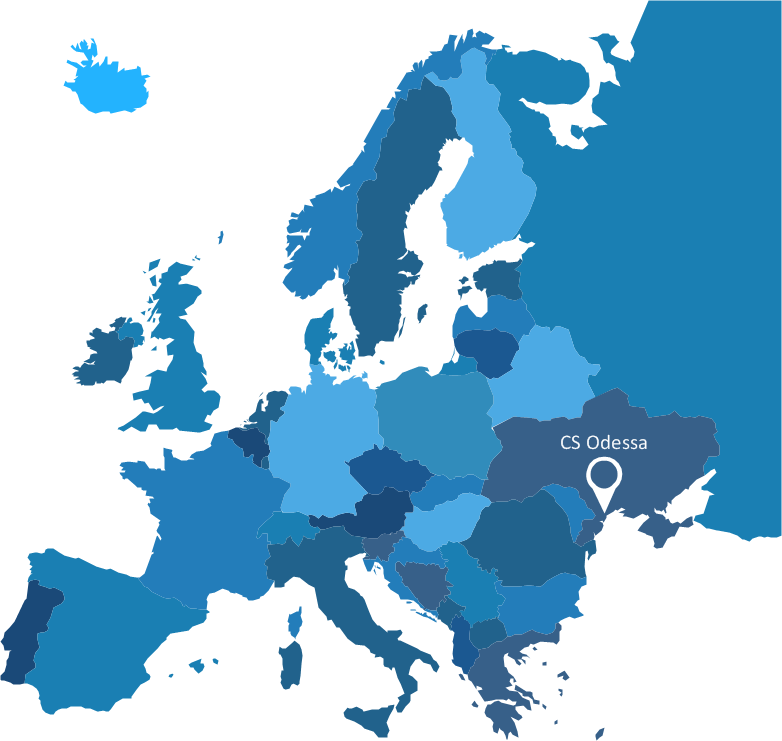
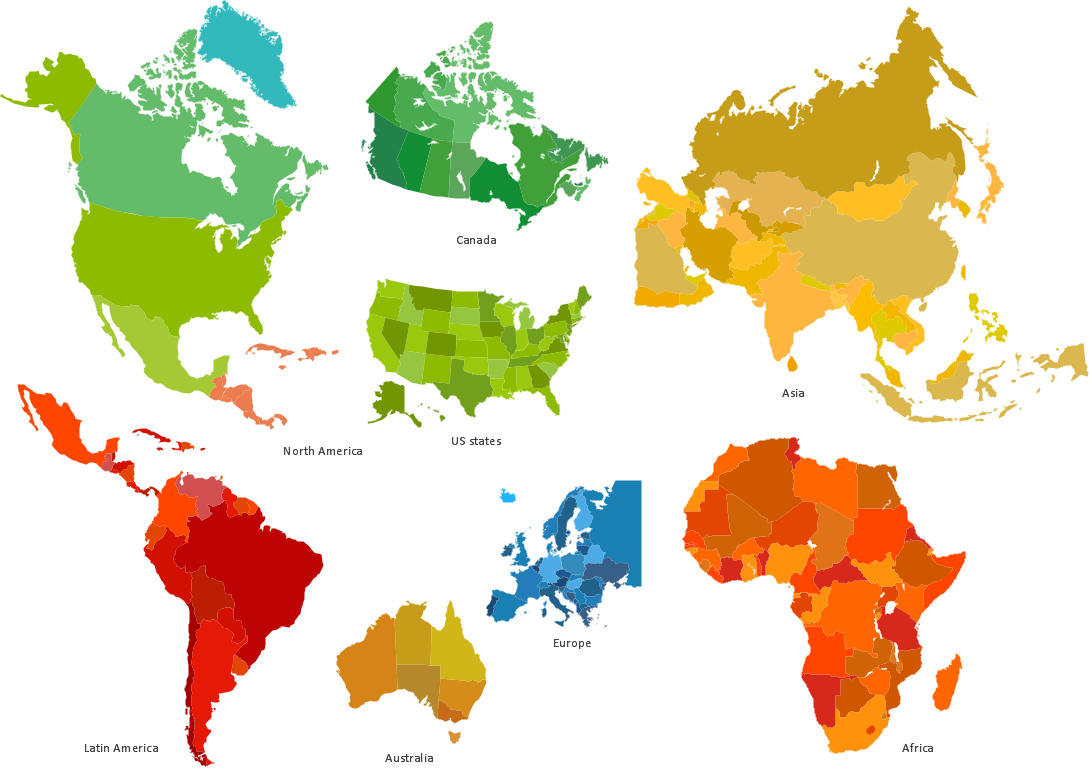
Take inspiration with ConceptDraw to visualise your maps and make eye-catching infographics.Spatial infographics Design Elements: Continental Map
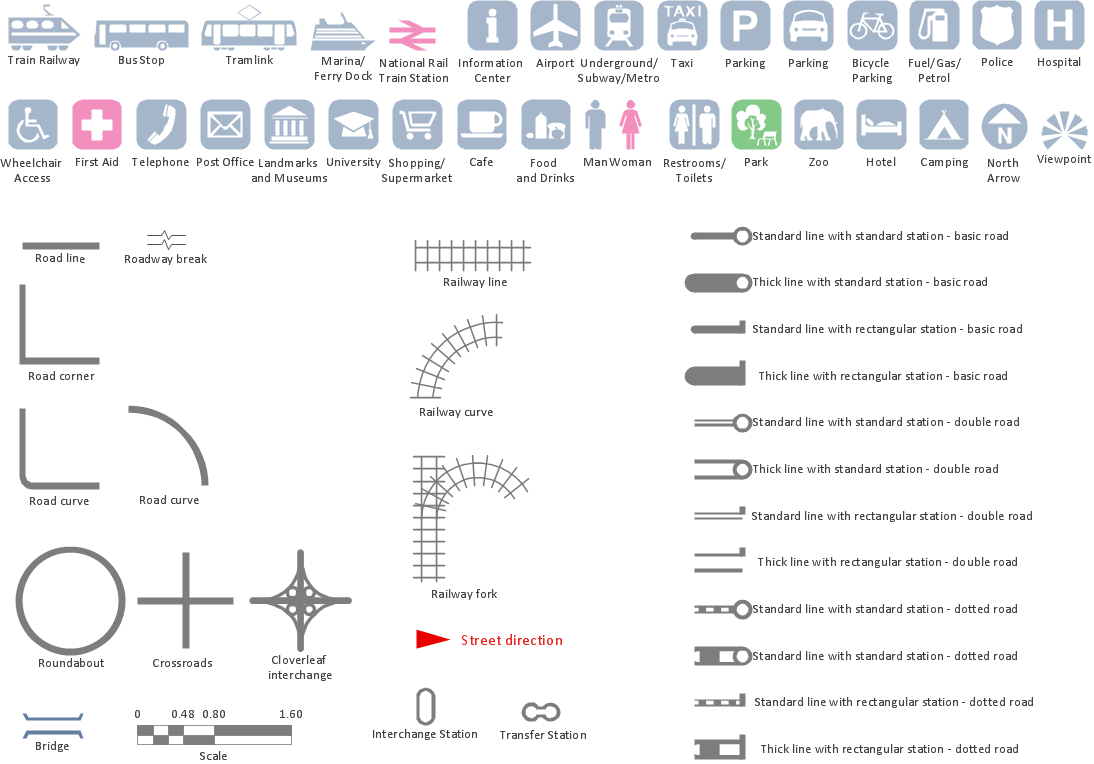
ConceptDraw PRO is a software for making infographics illustrations. You can work with various components to build really impressive and easy-to-understand infographics design.Spatial infographics Design Elements: Transport Map
Do you like infographics and data visualization? Creating infographics is super-easy with ConceptDraw.Excellent Examples of Infographic Maps
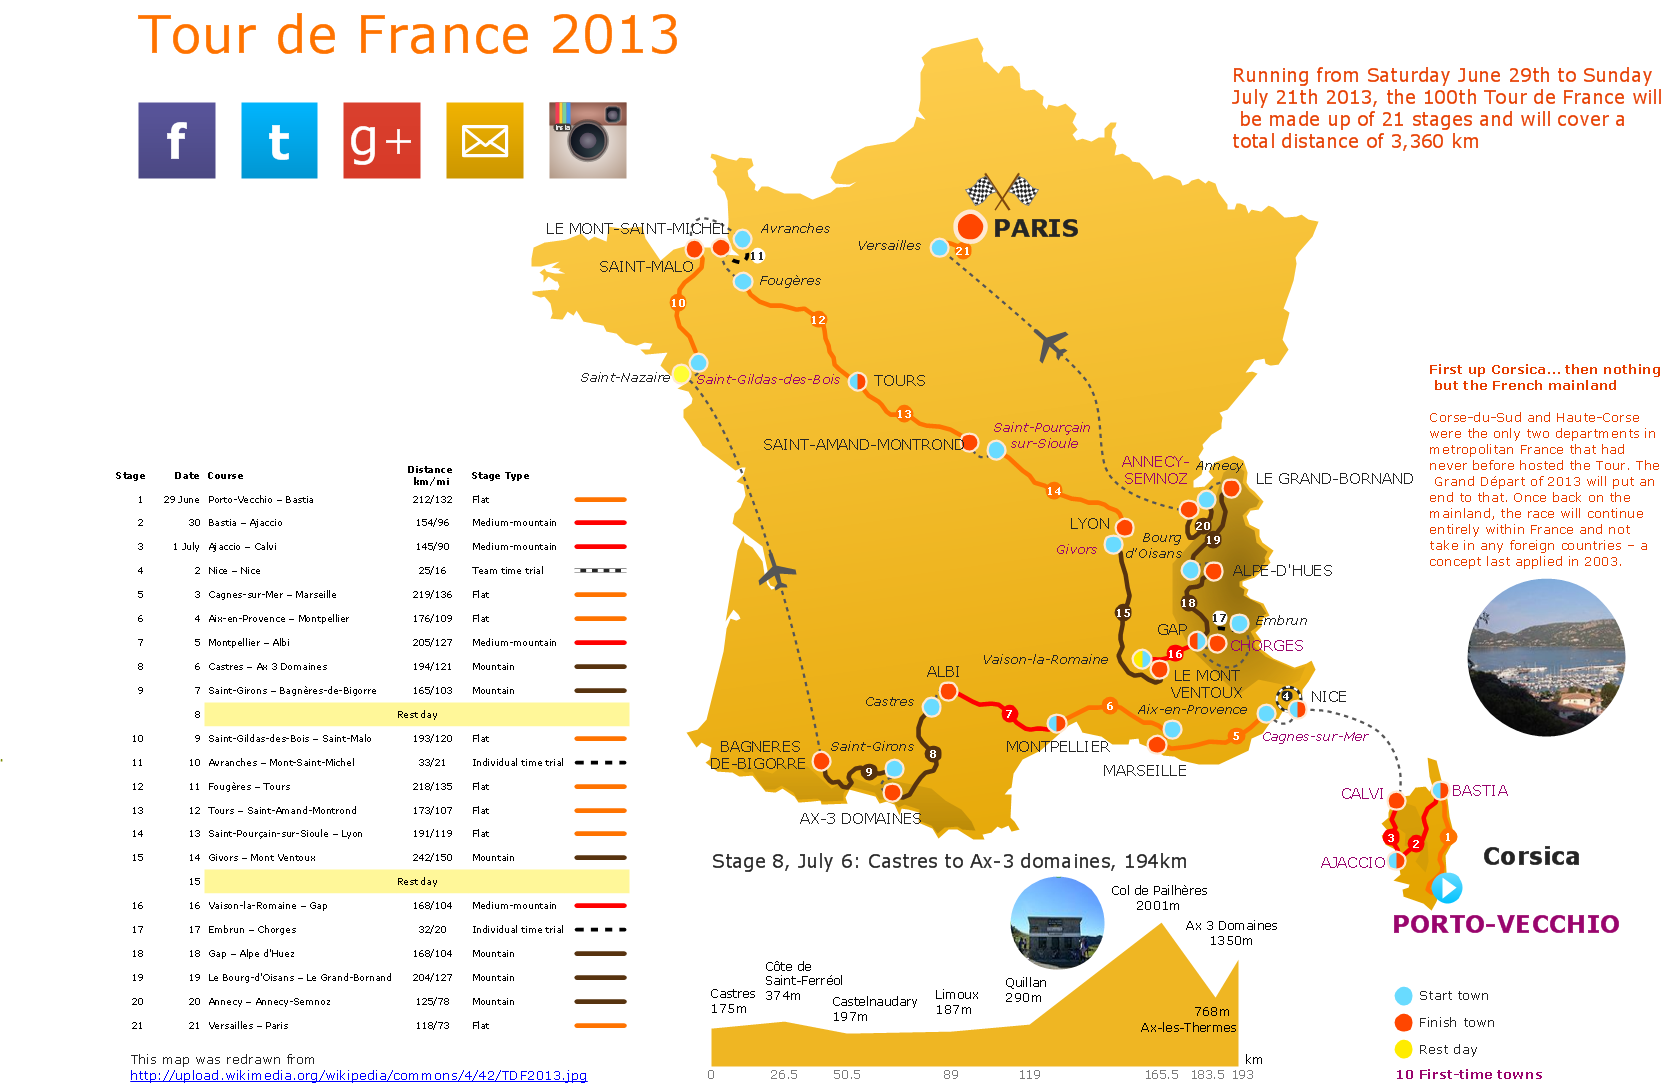
Create Spatial infographics with ConceptDraw using its excellent examples of infographic maps. We hope these can inspire and teach you!Visualization Spatial Data Using Thematic Maps Combined with Infographics
Now anyone can build an infographics from their data using ConceptDraw. Nice and simple, but the features it have are power-packed!Pie Chart Word Template. Pie Chart Examples
The Pie Chart visualizes the data as the proportional parts of a whole and looks like a disk divided into sectors. The pie chart is type of graph, pie chart looks as circle devided into sectors. Pie Charts are widely used in the business, statistics, analytics, mass media. It’s very effective way of displaying relative sizes of parts, the proportion of the whole thing.Best Tool for Infographic Construction
ConceptDraw is a best data visualization tool that will allow everyone to create rich infographics and visualizations quickly and easily.Informative and Well-Designed Infographics
Informative and well-designed Infographics allows visually present various map containing information.3 Circle Venn Diagram. Venn Diagram Example
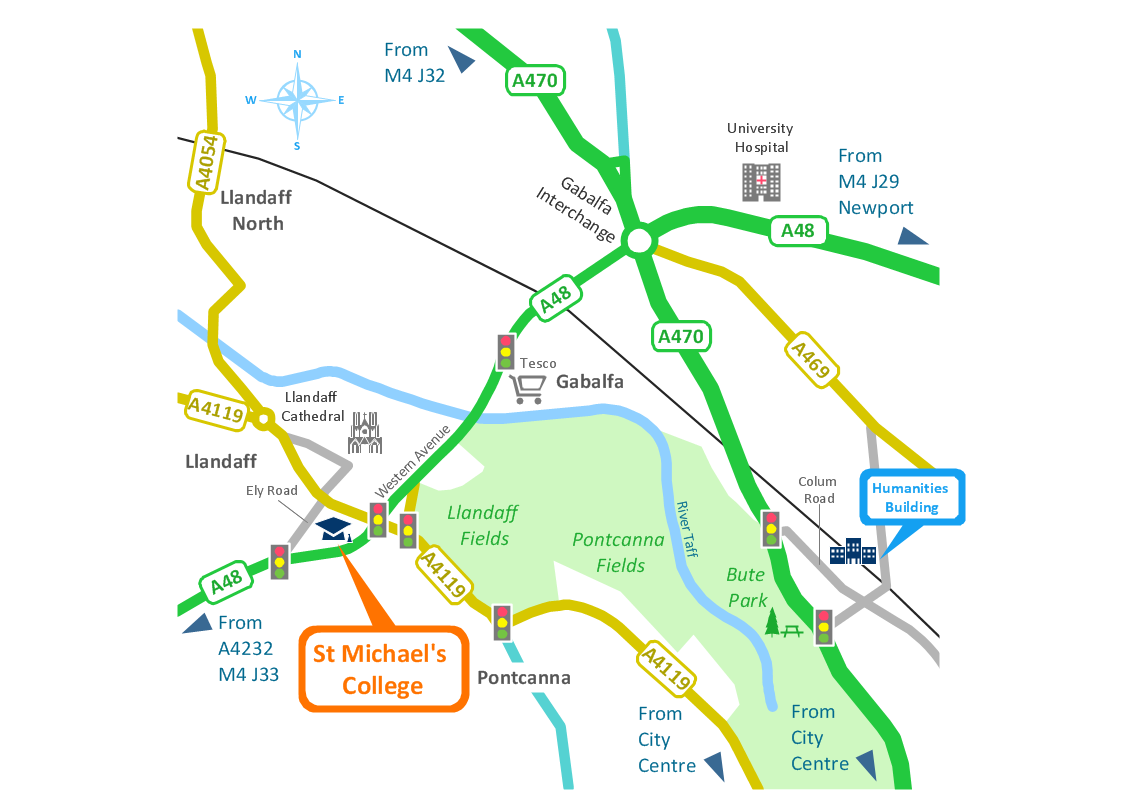
This template shows the Venn Diagram. It was created in ConceptDraw PRO diagramming and vector drawing software using the ready-to-use objects from the Venn Diagrams Solution from the "What is a Diagram" area of ConceptDraw Solution Park. Venn Diagrams visualize all possible logical intersections between several sets and are widely used in mathematics, logic, statistics, marketing, sociology, etc.Brilliant Examples of Infographics Map, Transport, Road
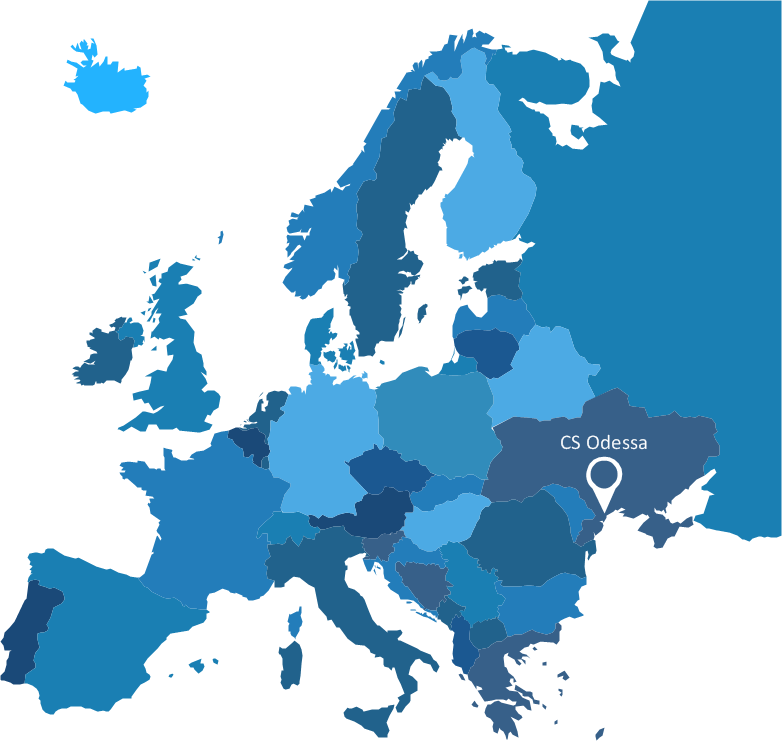
ConceptDraw PRO contains spatial infographics samples, map templates to be filled in, and libraries of vector stencils for main design elements of spatial infographics.Spatial infographics Design Elements: Location Map
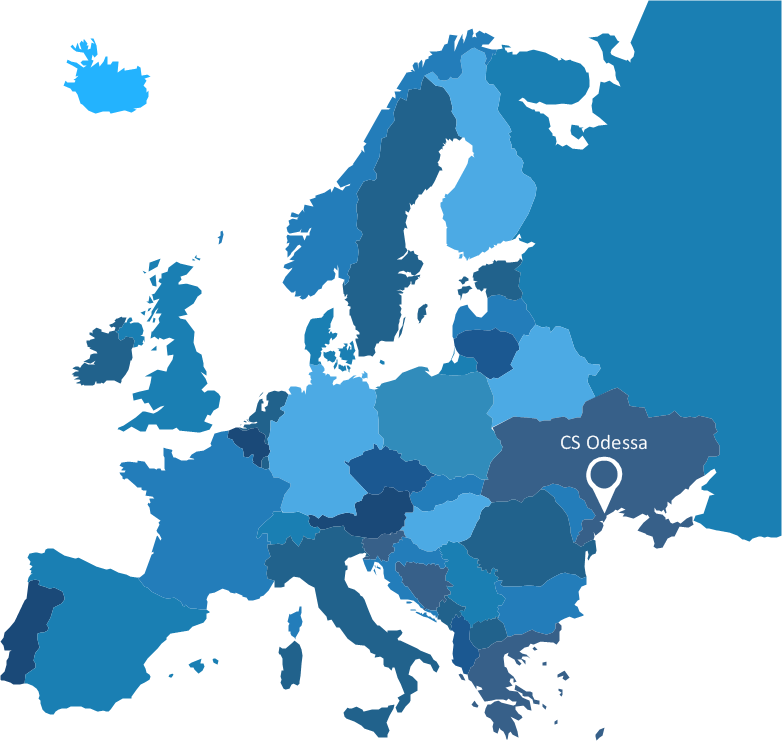
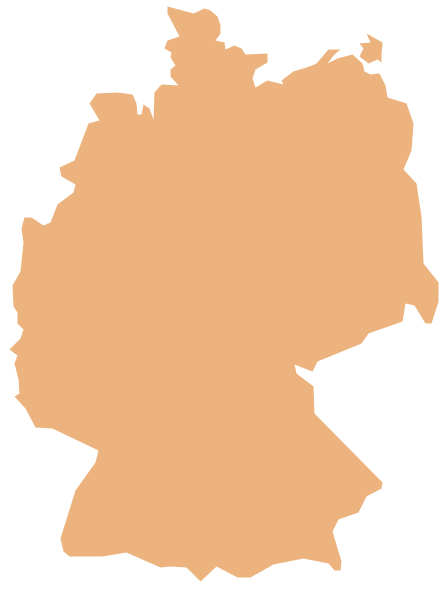
Infographic Design Elements for visually present various geographically distributed information.Geo Map — Europe — Germany
The vector stencils library Germany contains contours for ConceptDraw PRO diagramming and vector drawing software. This library is contained in the Continent Maps solution from Maps area of ConceptDraw Solution Park.Pie Chart Examples and Templates
A pie chart or a circle graph is a circular chart divided into sectors, illustrating numerical proportion. In a pie chart, the arc length of each sector and consequently its central angle and area, is proportional to the quantity it represents. Pie chart examples and templates created using ConceptDraw PRO software helps you get closer with pie charts and find pie chart examples suite your needs.Superb Examples of Infographic Maps
Great examples of Infographic Maps, they are needed for inspiration.- Concept Maps | Cylinder Venn Diagram | Venn Diagram Template ...
- Blank Road Map Template
- Spatial infographics Design Elements: Continental Map | Continents ...
- Stats Template
- North America map - Template | North America - Vector stencils ...
- Cross-Functional Process Map Template | Automated payroll ...
- Automated payroll management system UML activity diagram ...
- Line graph - Template | Geo Map - Asia - Philippines | Graph ...
- Winter Sports. Illustrations and Visualize Statistics | Information ...
- Examples Of Statistics Concept Map
- Flowchart Software | Cross-Functional Process Map Template ...
- Value Stream Mapping Template | SWOT Template | Relative Value ...
- How To Solve Pie Chart In Social Statistics
- Blank Concept Map Template
- Geo Map — United States of America Map | North America map with ...
- Bar Chart Template for Word
- Circle Spoke Diagram Template | Basic Flowchart Symbols and ...
- Internet marketing - Concept map | What Is a Concept Map | Leaky ...
- North America map - Template | North America map - Template ...
