Pie Chart Examples and Templates
A pie chart or a circle graph is a circular chart divided into sectors, illustrating numerical proportion. In a pie chart, the arc length of each sector and consequently its central angle and area, is proportional to the quantity it represents. Pie chart examples and templates created using ConceptDraw PRO software helps you get closer with pie charts and find pie chart examples suite your needs.Winter Sports. Illustrations and Visualize Statistics
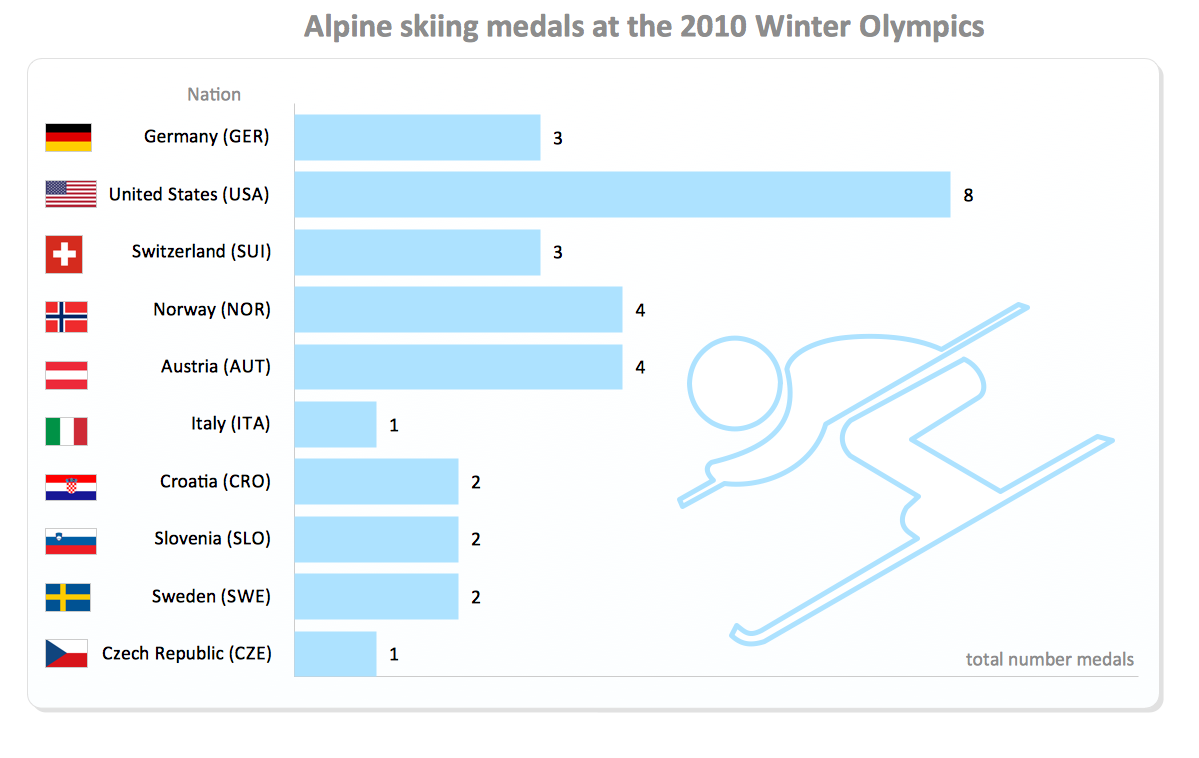
Visualizing sports statistics becomes as easy as never before with ConceptDraw PRO software extended with the Winter Sports solution. This solution delivers a complete set of winter sports illustrations, samples and templates you may use to visualize any kind of sports statistics in minutes.Typography Font
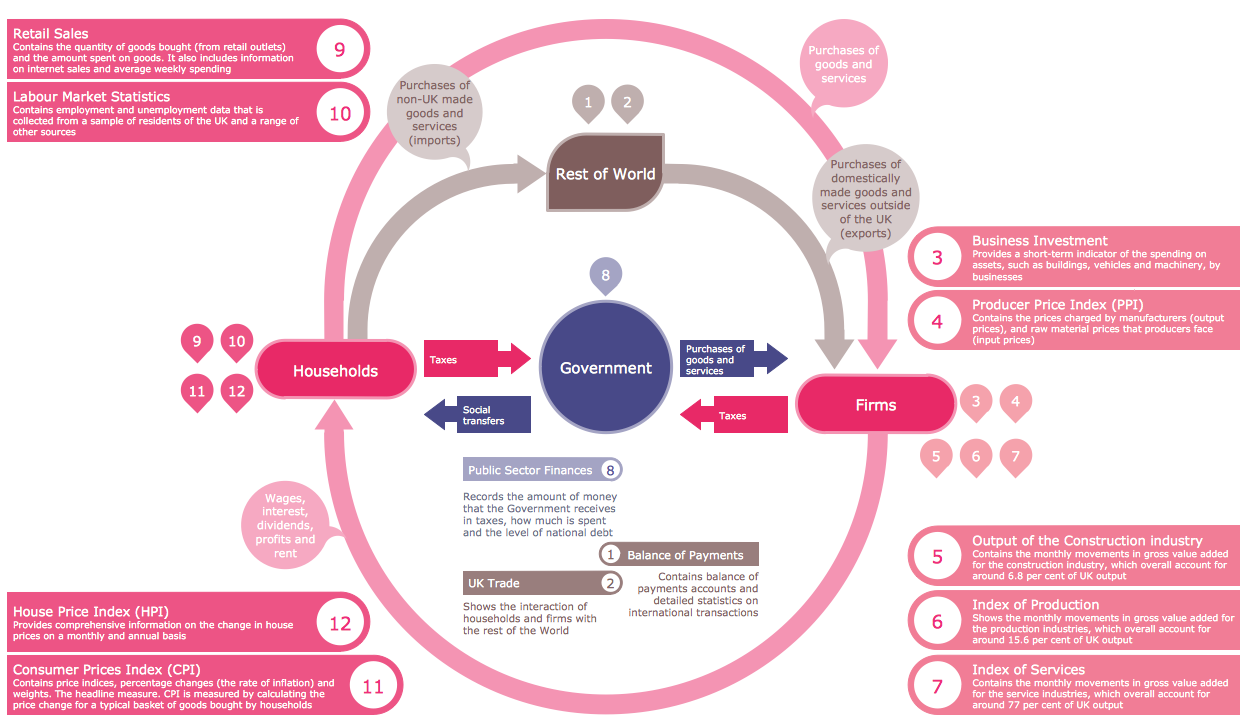
How to create an infographic and make it successful and professional looking? It is a complex process with great quantity of important moments that you should consider. Design and Typography Font play the significant role in the success of typography graphic. Typography Font makes your Typography Infographic unique and attractive. ConceptDraw PRO extended with Typography Infographics Solution from the “What are Infographics” Area provides you the useful tools for simple and quick designing various Typography Infographics.How to draw Metro Map style infographics? Moscow, New York, Los Angeles, London
The solution handles designs of any complexity, and the comprehensive library covers all key aspects of a transportation system. To further enhance your map design, there is the option to embed links, that can display station images or other relevant, important information. We have also included a set of samples in the solution, that show the possible real-world application — complex tube systems including the London Tube and New York City Subway show the level of detail possible when using the Metro Map Solution.
 Seven Management and Planning Tools
Seven Management and Planning Tools solution extends ConceptDraw PRO and ConceptDraw MINDMAP with features, templates, samples and libraries of vector stencils for drawing management mind maps and diagrams.
State Machine Diagram
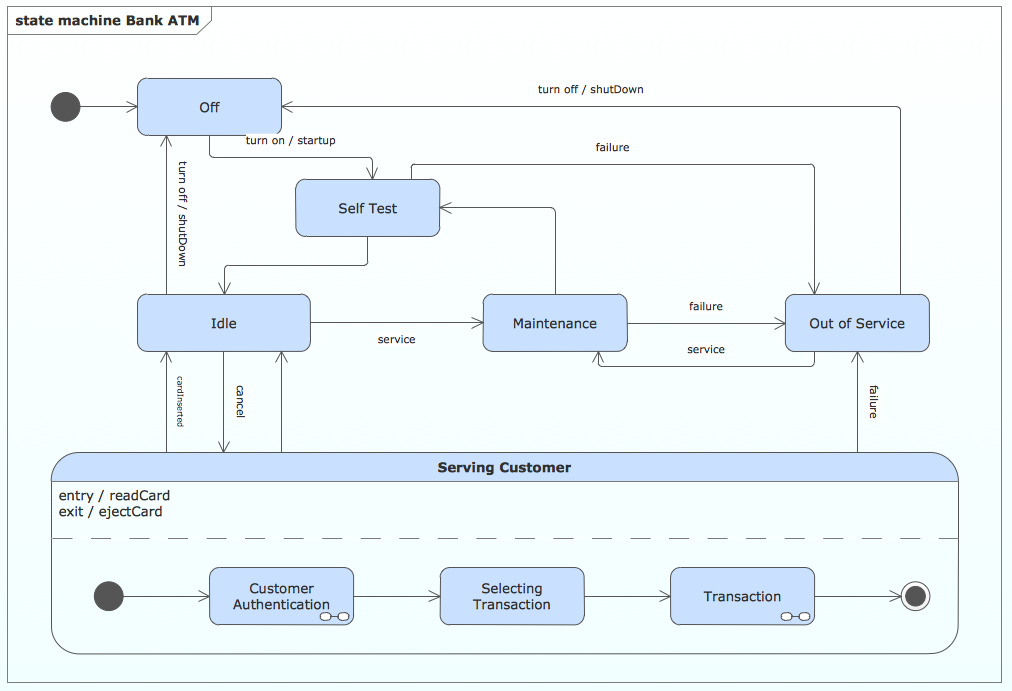
UML state machine's goal is to overcome the main limitations of traditional finite-state machines while retaining their main benefits. ConceptDraw is ideal for software designers and software developers who need to draw UML State Machine Diagrams.
- Bar Chart Examples | Bar Chart Software | Column Chart Template ...
- Pie Chart Examples and Templates | Pie Chart Software | Business ...
- Pie Charts | Arrow circle chart - Template | Pie Chart Examples and ...
- 3 Circle Venn Diagram. Venn Diagram Example | Tree Network ...
- Visualization Solution With Free Templates
- Circles Venn Diagram
- Venn Diagrams | Venn Diagram Examples for Problem Solving ...
- Spider Chart Template | Percentage Spider Chart | Chart Maker for ...
- Typography Font | Ice Hockey Rink Diagram | Us Stats Map
- Small Business Statistics – UK 2013 | Typography Font | Singapore ...
- Winter Sports. Illustrations and Visualize Statistics | International ...
- Sales Growth. Bar Graphs Example | Line Chart Examples ...
- Serious crime in Cincinnati | Bar Graphs | Column Chart Examples ...
- Stats Icon Png
- Draw Two Constellation Stats
- How to Draw a Divided Bar Chart in ConceptDraw PRO | Divided ...
- Bar Chart Examples | How to Draw a Divided Bar Chart in ...
- How To Use A Rectangular Column Chart
- What Are The Stats Involved In Accounting Process
- Swim Lane Flowchart Symbols | Cross-Functional Flowchart (Swim ...


