How to Create Presentation of Your Project Gantt Chart
During the planning, discussing and execution of a project you may need to prepare a presentation using project views such as the Gantt Chart, Multiproject Dashboard or Resource Usage View. It’s easy do with ConceptDraw PROJECT!Balanced Scorecard Software
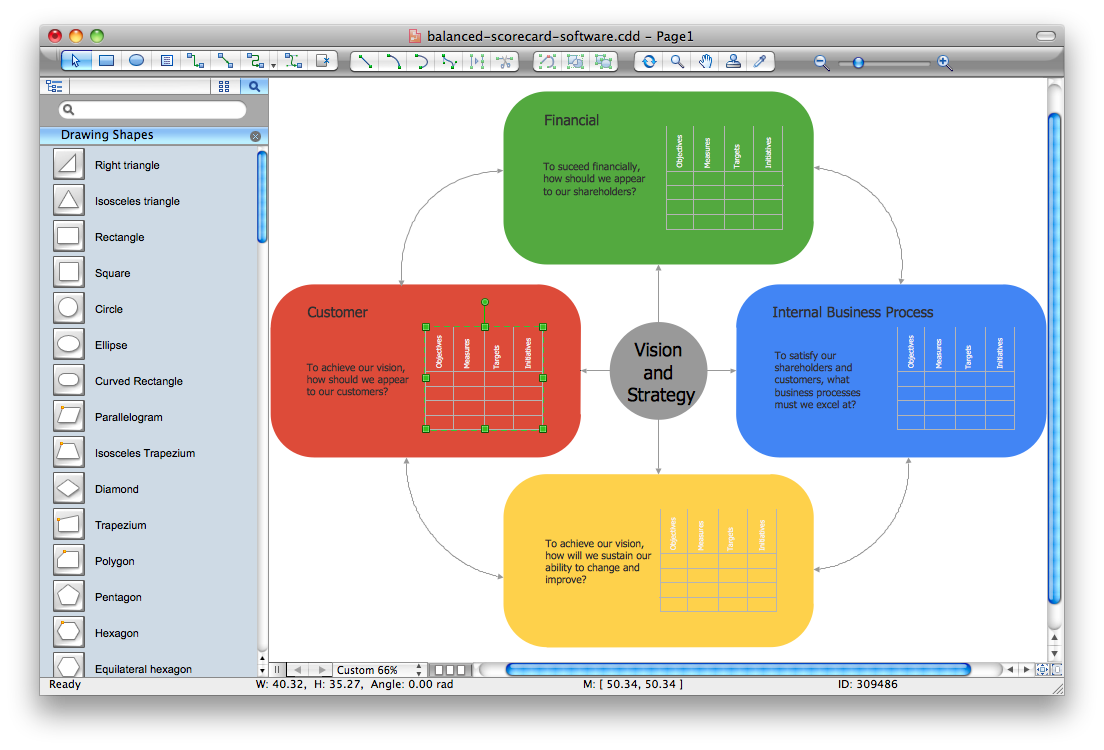
Balanced Scorecard Software provide incredible large variety of samples, templates and libraries of predesigned vector objects. Nothing could be easy that use the predesigned template and fill it, and simply drag the ready-to-use objects for designing your own balanced scorecard diagram.Dashboard
ConceptDraw PRO extended with Sales Dashboard solution from the Marketing area of ConceptDraw Solution Park is a perfect software for creating the live dashboard for the business data and progress visualization.Communication Tool for Remote Project Management
Communication is the main challenge and the key success factor for remote project management. Communicating visually via Skype you bring all team and customers onto the one page. Remote Presentation for Skype solution for ConceptDraw MINDMAP helps communicate with remote team and customers in visual manner on wide range of issues. Using this solution for regular status meetings allows you to push your team on tasks and keep task statuses up to date.HelpDesk
How to Track Your Project Plan vs. the Actual Project Condition
Conceptdraw PROJECT provides user with the possibility to track how the project is going. Project Manager can compare the actual data with the planned and assess possible measures to resolve issues. Conceptdraw PROJECT has several types of visual reports that can help to assess visually the difference between planned and actual project data.Competitor Analysis
Competitor analysis is a first and obligatory step in elaboration the proper corporate marketing strategy and creating sustainable competitive advantage. Use powerful opportunities of numerous solutions from ConceptDraw Solution Park for designing illustrative diagrams, charts, matrices which are necessary for effective competitor analysis.
 Time Series Dashboard
Time series dashboard solution extends ConceptDraw PRO software with templates, samples and vector stencils libraries with charts, graphs and plots for drawing the visual dashboards showing data time series.
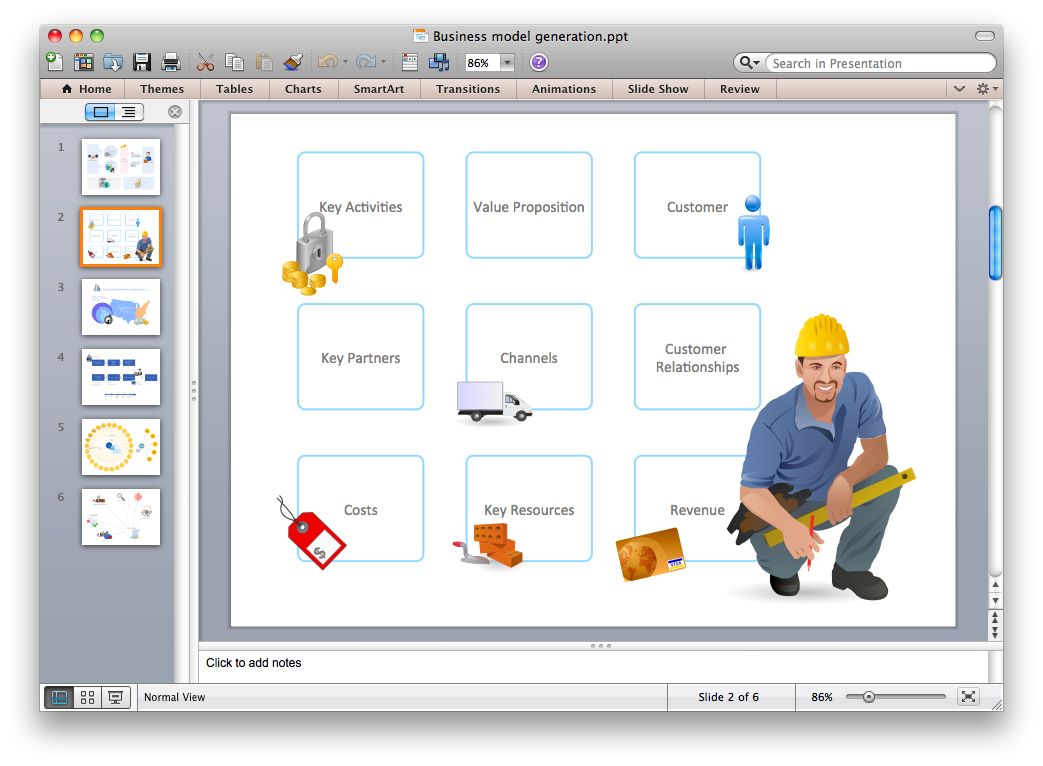
Export from ConceptDraw PRO Document to PPT or PPTX (MS PowerPoint®) File
ConceptDraw PRO has extensive export capabilities which allow you to export your drawing to
 Azure Architecture
Create Microsoft Azure architecture diagrams using icons and templates regarding Azure management, Azure storage and Azure services.
 Plant Layout Plans
This solution extends ConceptDraw PRO v.9.5 plant layout software (or later) with process plant layout and piping design samples, templates and libraries of vector stencils for drawing Plant Layout plans. Use it to develop plant layouts, power plant desig
Presenting a Slide Show to a Group of People
Tips on how to present a slide show to a group. Deliver a successful presentation to your team.
 Fault Tree Analysis Diagrams
This solution extends ConceptDraw PRO v9.5 or later with templates, fault tree analysis example, samples and a library of vector design elements for drawing FTA diagrams (or negative analytical trees), cause and effect diagrams and fault tree diagrams.
 Network Layout Floor Plans
Network Layout Floor Plan solution extends ConceptDraw PR software with samples, templates and libraries of vector stencils for drawing the computer network layout floor plans.
 ConceptDraw Solution Park
ConceptDraw Solution Park collects graphic extensions, examples and learning materials
KPI Dashboard
ConceptDraw PRO diagramming and vector drawing software supplied with Sales Dashboard solution from the Marketing area of ConceptDraw Solution Park provides the full set of useful tools which make it the best for producing the live KPI Dashboard of any complexity.- PM Dashboards | Status Dashboard | Frequency Distribution ...
- Status Dashboard | Project management task status dashboard ...
- Sales Dashboard Template | Project task status dashboard ...
- Status Dashboard | PM Dashboards | Comparison Dashboard | Free ...
- How to Report on Multiple Projects Status | Project management ...
- Status Dashboard | Gant Chart in Project Management ...
- Free Dashboard Templates Powerpoint
- Dashboard Project Management Kpi
- Project Management Powerpoint Presentation Slides
- Fishbone Diagrams | Business Diagram Software | Status ...
- Fishbone Diagrams | Competitor Analysis | Status Dashboard ...
- How to Create Presentation of Your Project Gantt Chart | Best ...
- Status Dashboard | TQM Diagram — Professional Total Quality ...
- Quality Dashboards
- Sales Dashboard | Azure Architecture | Status Dashboard | Server ...
- Fishbone Diagrams | Competitor Analysis | Status Dashboard | Fish ...
- Constant improvement of key performance indicators | TQM Diagram ...
- Project — Assigning Resources | How To Implement Collaborative ...
- KPIs and Metrics | Sales metrics and KPIs - Visual dashboard | Meter ...
- KPI Dashboard | Sales Dashboards for Your Company | Sales KPI ...


