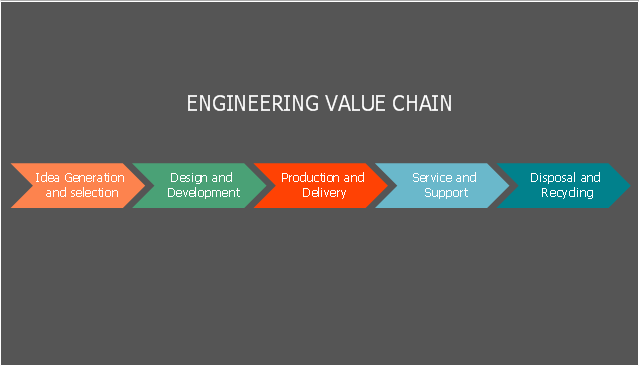
This step chart sample was created on the base of the webpage from the website Invest Punjab (Invest Punjab,
Punjab Bureau of Investment Promotion).
"Opportunities in Agro and Food Processing sector in Punjab:
(1) “Food Bowl of India” - Leading food producer of India with intensive cultivation of 2-3 crops per year.
(2) Highly mechanized agricultural practices with irrigation network available to 98% of the cultivable land.
(3) Robust infrastructure and a well developed ecosystem." [progressivepunjab.gov.in/ opportunitiesdetails.aspx?id=7]
The step chart example "Opportunities in agro and food processing sector in Punjab" was created using the ConceptDraw PRO diagramming and vector drawing software extended with the Marketing Diagrams solution from the Marketing area of ConceptDraw Solution Park.
 Marketing Diagrams
This solution extends ConceptDraw PRO with samples, templates and library of design elements for drawing the marketing diagrams.
 Flowcharts
The Flowcharts Solution for ConceptDraw PRO v10 is a comprehensive set of examples and samples in several different color themes for professionals that need to graphically represent a process. Solution value is added by basic flow chart template and shapes' library of Flowchart notation. ConceptDraw PRO flow chart creator lets one depict a processes of any complexity and length, as well design of the flowchart either vertically or horizontally.
 Cross-Functional Flowcharts
Cross-functional flowcharts are powerful and useful tool for visualizing and analyzing complex business processes which requires involvement of multiple people, teams or even departments. They let clearly represent a sequence of the process steps, the order of operations, relationships between processes and responsible functional units (such as departments or positions).
 Business Process Diagrams
Business Process Diagrams solution extends the ConceptDraw PRO BPM software with RapidDraw interface, templates, samples and numerous libraries based on the BPMN 1.2 and BPMN 2.0 standards, which give you the possibility to visualize equally easy simple and complex processes, to design business models, to quickly develop and document in details any business processes on the stages of project’s planning and implementation.
- Opportunities in agro and food processing sector in Punjab ...
- Opportunities in agro and food processing sector in Punjab | Flow ...
- Opportunities in agro and food processing sector in Punjab | Geo ...
- Definition Of Flow Chart In Food Processing
- Flowchart Symbols Food Processing
- Food security assessment - Flowchart | Opportunities in agro and ...
- Food Processing Flow Charts
- How To Draw Food Processing Flow Sheet
- Food Processing Organizational Structural Plans
- Sample Of A Food Processing Organizational Structure
- Why Is Flowchart Design Needed In Food Processing
- Symbols Of Equipment Used In Food Processing
- Food Processing Flow Chart
- Food Processing Companys Organizational Chart
- Flow Chart Food Management And Processing
- Graphical Steps In Algorithm On Food
- Layout Of Flow Chart In Food Processing Engineering
- Step chart - Template | Step chart - Cloud testing steps | Flow chart ...
- Food Processing Industries In India Flow Chart
- Process Flow Chart For Food Production
