 Value Stream Mapping
Value stream mapping solution extends ConceptDraw PRO software with templates, samples and vector stencils for drawing the Value Stream Maps (VSM) in lean manufacturing practice.
Flow Map
A Flow Map is a type of thinking maps which help easy organize and understand information. It consists of the set of boxes and arrows, and visually displays a sequence of events. ConceptDraw PRO diagramming and vector drawing software extended with Flowcharts Solution from the "What is a Diagram" Area of ConceptDraw Solution Park allows you to draw in a few minutes the Flow Map of any degree of complexity.HelpDesk
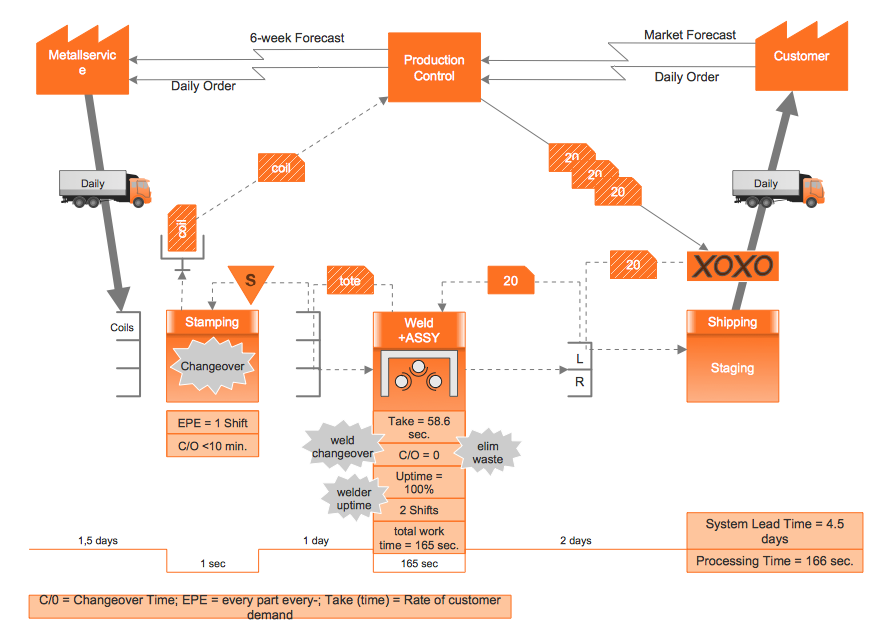
How to Create a VSM Diagram Using ConceptDraw Value Stream Mapping Solution
Value Stream Mapping is a Lean Manufacturing tool that uses a flow diagram to document in great detail every step of a manufacturing process. This graphical representation of a process is a powerful tool that helps in the diagnosis of process efficiency and allows companies to develop improved processes. Many lean practitioners use Value Stream Mapping as a fundamental tool to identify waste, cut process cycle times, and implement process improvement. Many organizations use value stream mapping as a key portion of their lean efforts. Value Stream Maps are used to analyze and design the flow of materials and information required to bring a product or service to a consumer. You can create a Value Stream Mapping flowchart using ConceptDraw PRO tools.Process Flow Chart
A Process Flow Chart is a type of flowchart which is mostly used in industrial, chemical and process engineering for illustrating high-level processes, major plant processes and not shows minor details. ConceptDraw PRO diagramming and vector drawing software extended with Flowcharts Solution from the "What is a Diagram" Area of ConceptDraw Solution Park is the best way to create Process Flow Chart and other types of flowcharts.Process Flow Diagram
A Process Flow Diagram (PFD) is a diagram which shows the relationships between the main components in a system. Process Flow Diagrams are widely used by engineers in chemical and process engineering, they allows to indicate the general flow of plant process streams and equipment, helps to design the petroleum refineries, petrochemical and chemical plants, natural gas processing plants, and many other industrial facilities. ConceptDraw PRO diagramming and vector drawing software extended with powerful tools of Flowcharts Solution from the "What is a Diagram" Area of ConceptDraw Solution Park is effective for drawing: Process Flow Diagram, Flow Process Diagram, Business Process Flow Diagrams.Value Stream & Process Flow Diagramming Software
Value Stream & Process Flow Diagramming Software is a very popular Lean Manufacturing tool that allows to see and visualize in details the company's processes and current state, the flow of material and information, and thus gives the possibility to analyze the efficiency of company's processes and then develop improved processes. Value stream maps are also a good way to define the steps that do not add value to the end product, in other words waste in a company's processes.Process Flow Maps
What is a Process Flow Map? It is a chart which visually illustrates a business process and how its steps work together. Process Flow Maps help companies define problem areas, inefficient activities for the purpose of further increasing performance and profitability of businesses. ConceptDraw PRO diagramming and vector drawing software extended with Flowcharts solution from the "What is a Diagram" area of ConceptDraw Solution Park is efficient and productive software for fast and simple creating professional looking Process Flow Map.Value Stream Management
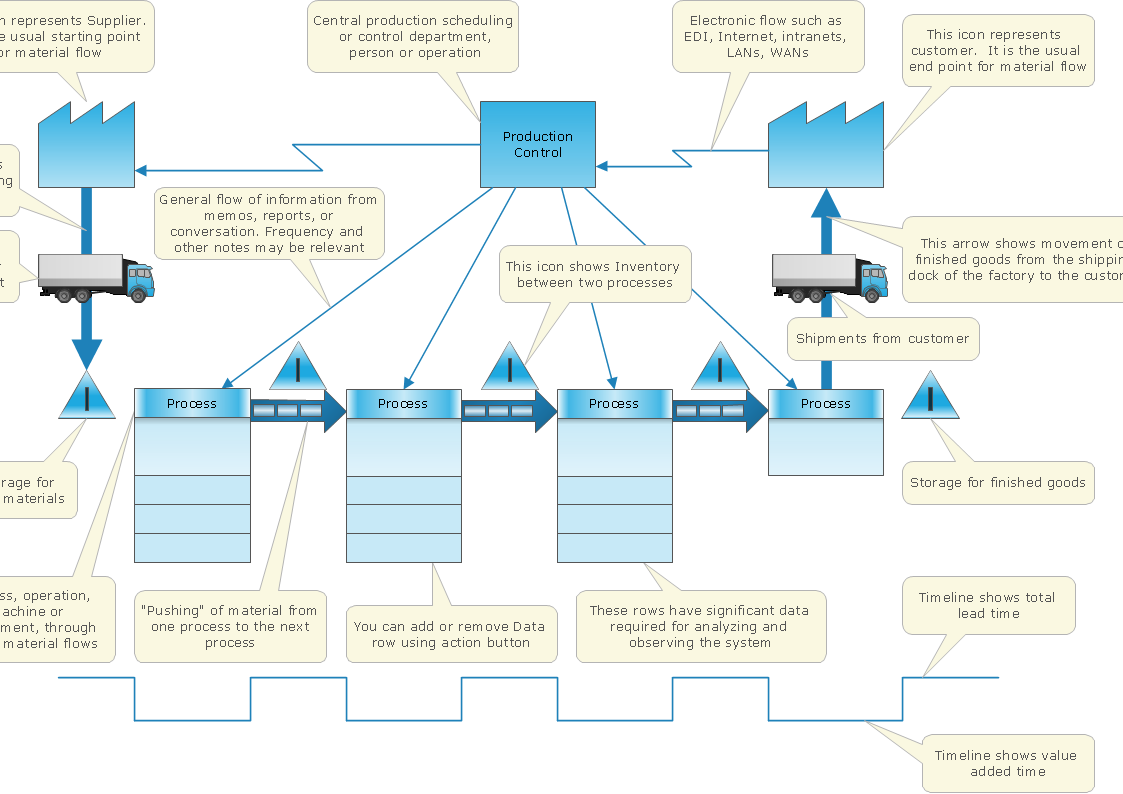
The Value Stream Mapping solution found in the ConceptDraw Solution Park continues to extend the range of ConceptDraw PRO v9 into a business graphics tool that can be used to document processes in any organization.Value stream with ConceptDraw PRO
The Value stream is a totality of all actions on the projection, order composition and production: starting from creation a product project to launching this product, from order to delivery, from extraction of raw materials to ready product manufacturing. Value stream mapping is a process of visualization of these actions and creation of a detailed and graphical map.How To create Value Stream Map (VSM)
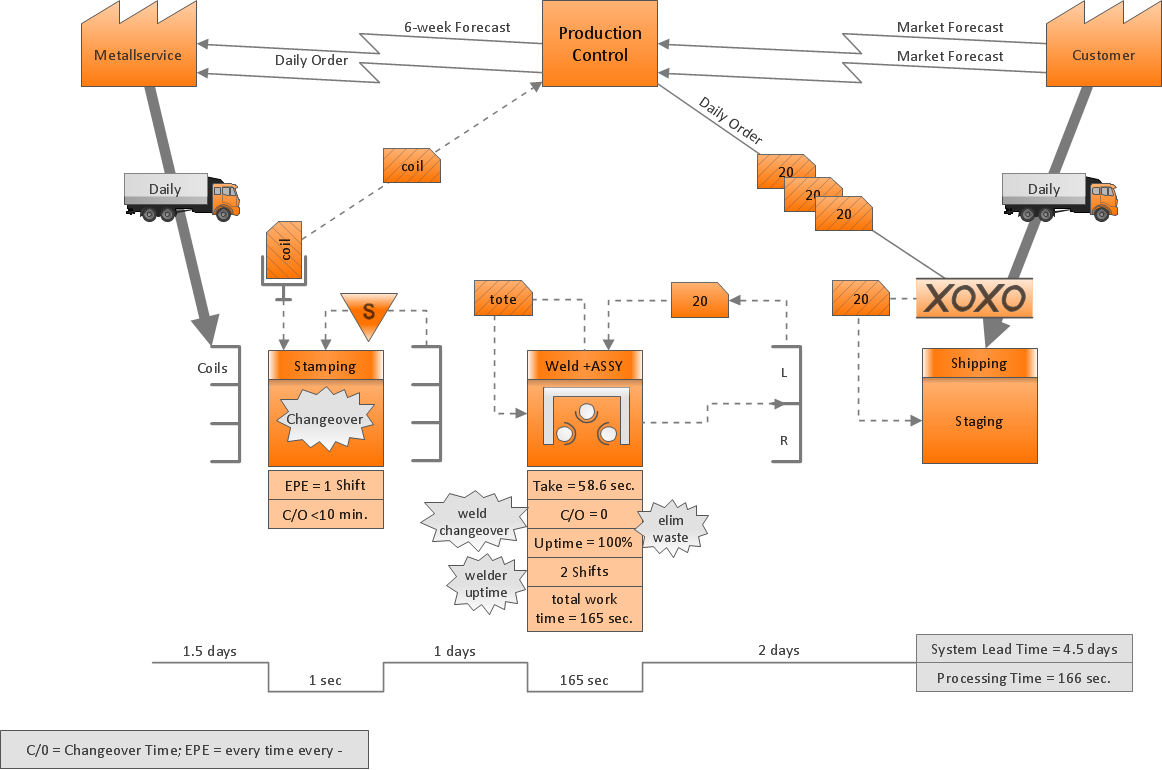
Value Stream Map template helps you to create VSM diagrams using ConceptDraw PRO software.Value Stream Mapping Template
Use ConceptDraw PRO extended with Value Stream Mapping solution for document processes with professional designed Value Stream Mapping template.Quality Engineering Diagrams
Create Quality Engineering Diagrams (value stream maps) - for value stream analysis and value stream management, material and information flow mapping, using our quick start templates included with ConceptDraw.
 Business Process Mapping
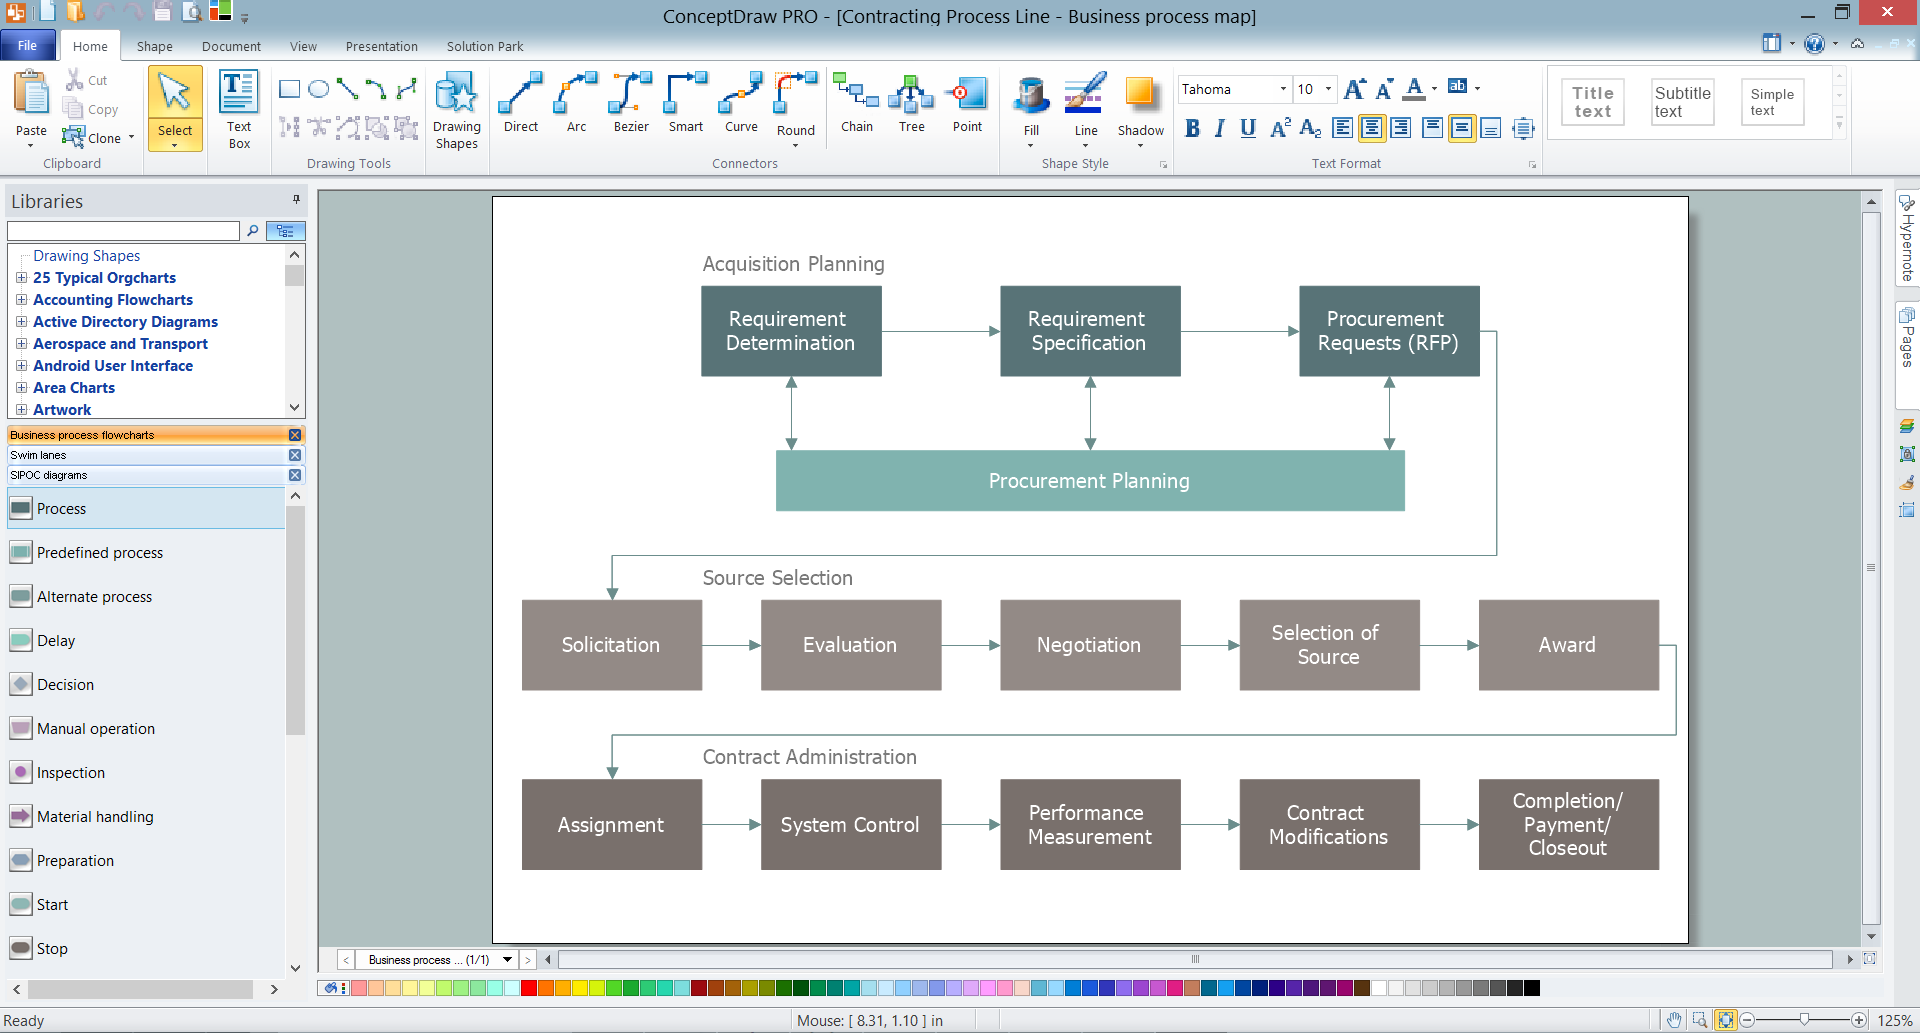
The Business Process Mapping solution for ConceptDraw PRO is for users involved in process mapping and creating SIPOC diagrams.
Business Mapping Software
Business process maps help you evaluate and manage quality in a work process chain, placing an emphasis on corporate performance and optimization. Business Mapping Software a versatile collection of libraries and templates, that allow you to create business process and SIPOC diagrams, using the Six Sigma methodology.- Concept Maps | How To Make a Concept Map | The Best Flowchart ...
- Nursing Concept Map Template
- Concept Maps | How To Make a Concept Map | What Is a Concept ...
- Process Flowchart | Value Stream Mapping | Basic Flowchart ...
- Nursing Concept Map
- Nursing Process Concept Map Template
- How To Make a Concept Map | What Is a Concept Map | Form Maker ...
- Flowchart Concept Map Definition
- Electrical Engineering | Basic Diagramming | Concept Maps ...
- Concept Map Trial
- Value Stream Mapping | How to Create a VSM Diagram Using ...
- Biology | Concept Maps | Value Stream Mapping | Biology Concept ...
- Concept Map Of Charts Of Accounts
- Value Stream Mapping | State Diagram Example - Online Store ...
- Concept Map Software Trial
- Concept Map | Simple Diagramming | Value Stream Mapping | Draw ...
- Concept Map Maker
- Flow Chart Concept Map Of Waste Management
- Safety and Security | Concept Maps | Flow chart Example ...


