Data structure diagram with ConceptDraw DIAGRAM
Data structure diagram (DSD) is intended for description of conceptual models of data (concepts and connections between them) in the graphic format for more obviousness. Data structure diagram includes entities description, connections between them and obligatory conditions and requirements which connect them. Create Data structure diagram with ConceptDraw DIAGRAM.Business diagrams & Org Charts with ConceptDraw DIAGRAM
The business diagrams are in great demand, they describe the business processes, business tasks and activities which are executed to achieve specific organizational and business goals, increase productivity, reduce costs and errors. They let research and better understand the business processes. ConceptDraw DIAGRAM is a powerful professional cross-platform business graphics and business flowcharting tool which contains hundreds of built-in collections of task-specific vector stencils and templates. They will help you to visualize and structure information, create various Business flowcharts, maps and diagrams with minimal efforts, and add them to your documents and presentations to make them successful. Among them are Data flow diagrams, Organization charts, Business process workflow diagrams, Audit flowcharts, Cause and Effect diagrams, IDEF business process diagrams, Cross-functional flowcharts, PERT charts, Timeline diagrams, Calendars, Marketing diagrams, Pyramids, Target diagrams, Venn diagrams, Comparison charts, Analysis charts, Dashboards, and many more. Being a cross-platform application, ConceptDraw DIAGRAM is very secure, handy, free of bloatware and one of the best alternatives to Visio for Mac users.
"Data flow diagrams are one of the three essential perspectives of the structured-systems analysis and design method SSADM. The sponsor of a project and the end users will need to be briefed and consulted throughout all stages of a system's evolution. With a data flow diagram, users are able to visualize how the system will operate, what the system will accomplish, and how the system will be implemented. The old system's dataflow diagrams can be drawn up and compared with the new system's data flow diagrams to draw comparisons to implement a more efficient system. Data flow diagrams can be used to provide the end user with a physical idea of where the data they input ultimately has an effect upon the structure of the whole system from order to dispatch to report. How any system is developed can be determined through a data flow diagram model.
In the course of developing a set of levelled data flow diagrams the analyst/ designers is forced to address how the system may be decomposed into component sub-systems, and to identify the transaction data in the data model.
Data flow diagrams can be used in both Analysis and Design phase of the SDLC.
There are different notations to draw data flow diagrams (Yourdon & Coad and Gane & Sarson), defining different visual representations for processes, data stores, data flow, and external entities." [Data flow diagram. Wikipedia]
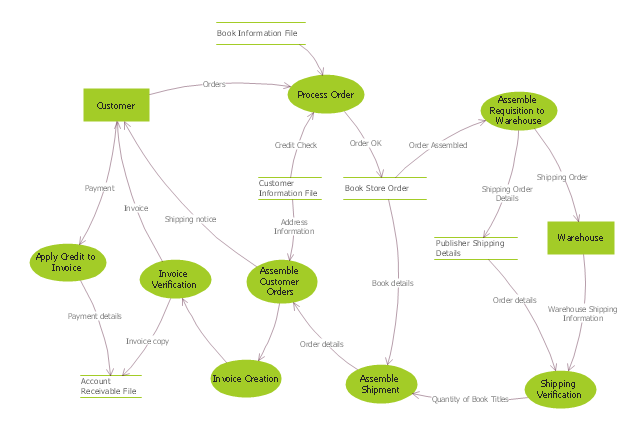
The DFD (Yourdon and Coad notation) example "Process of account receivable" was created using the ConceptDraw PRO diagramming and vector drawing software extended with the Data Flow Diagrams solution from the Software Development area of ConceptDraw Solution Park.
Garrett IA Diagrams with ConceptDraw DIAGRAM
Garrett IA diagrams are used at development of Internet-resources, in particulars at projecting of interactions of web-resource elements. The diagram of information architecture of the web resource which is constructed correctly with necessary details presents to developers the resource in comprehensible and visual way.Control and Information Architecture Diagrams (CIAD) with ConceptDraw DIAGRAM
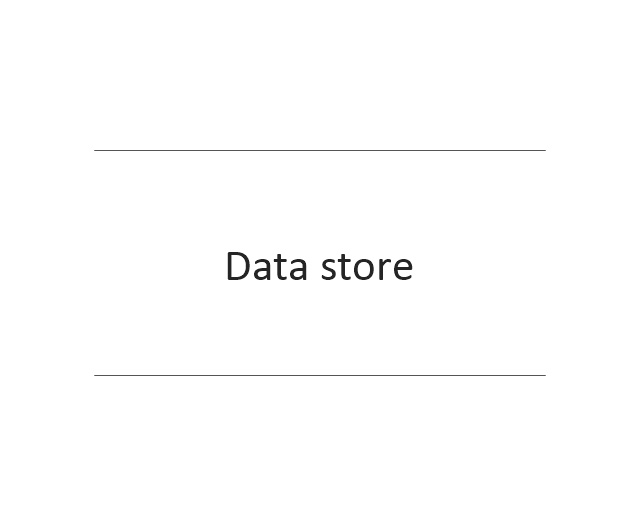
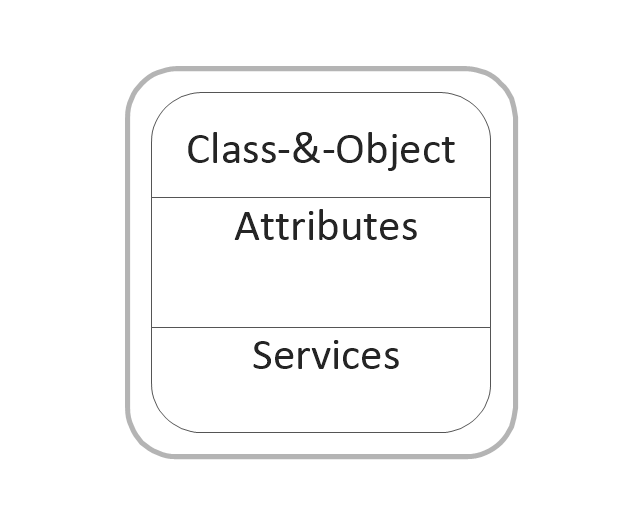
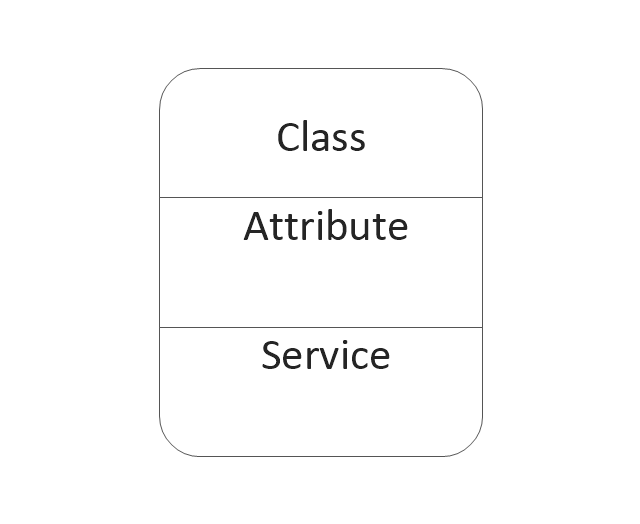
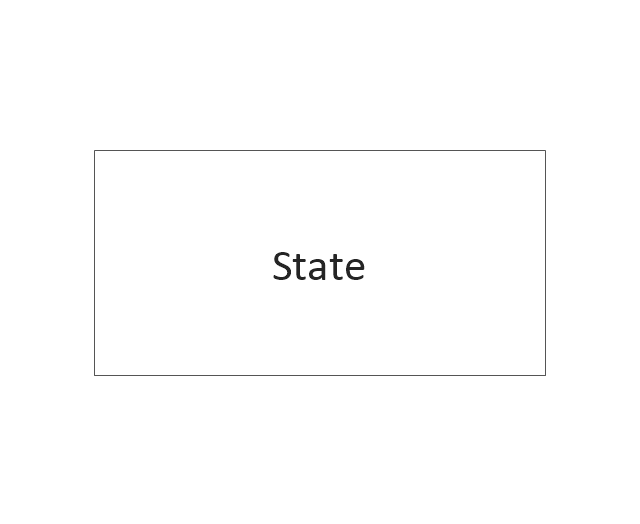
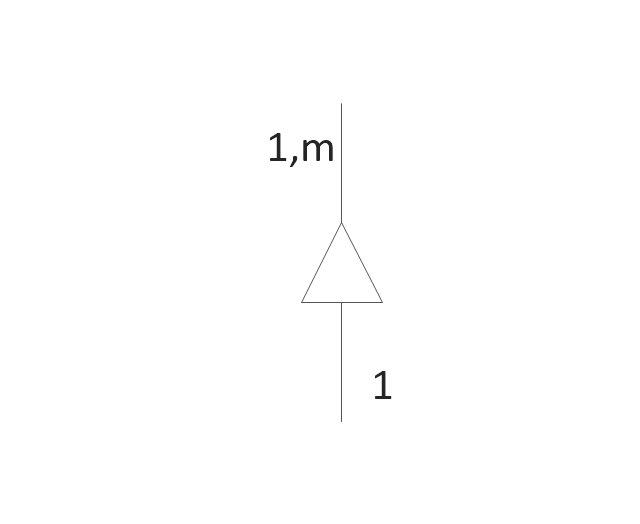
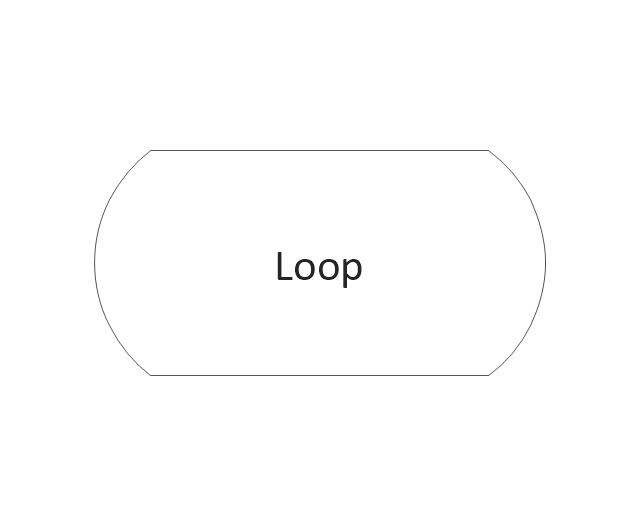
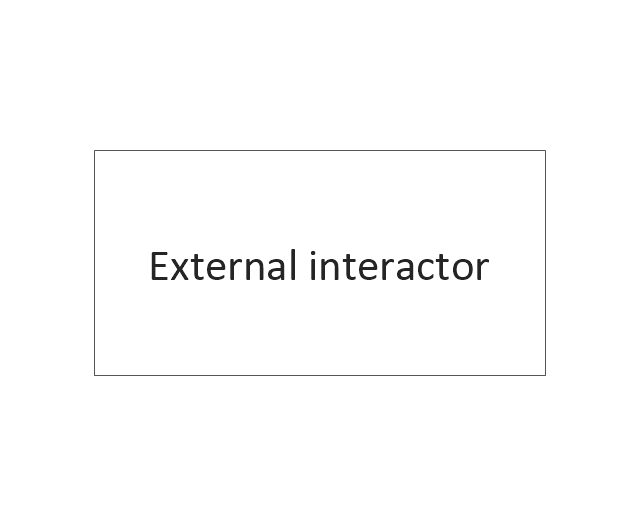
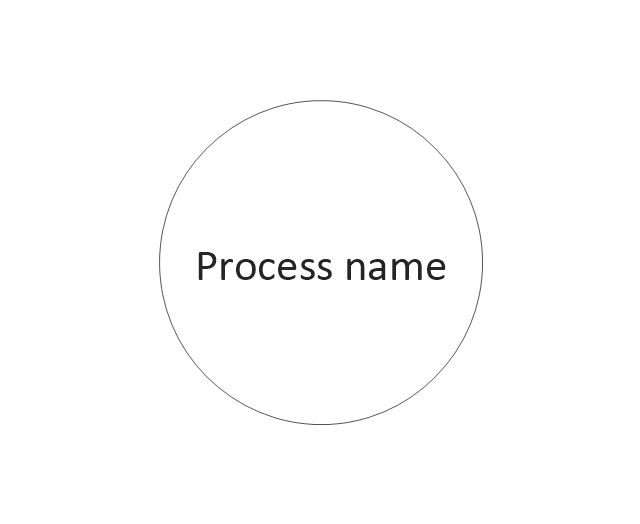
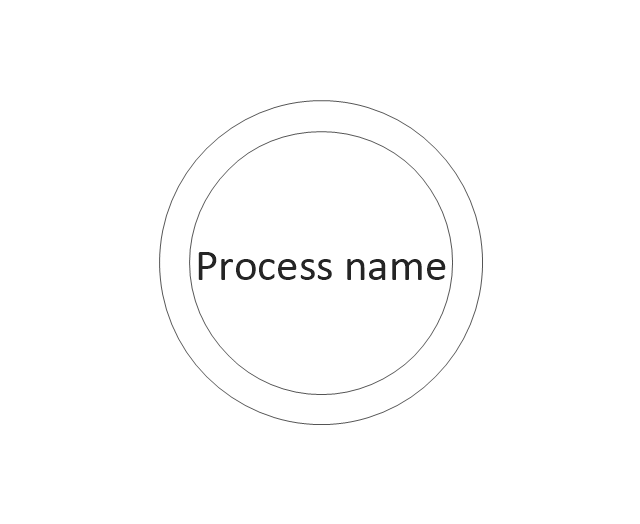
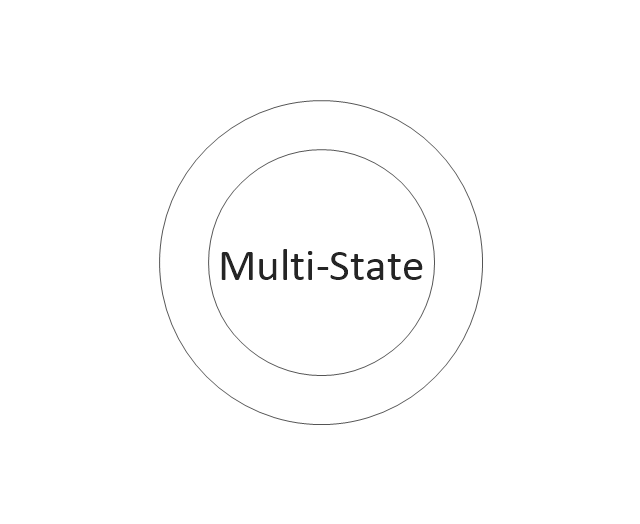
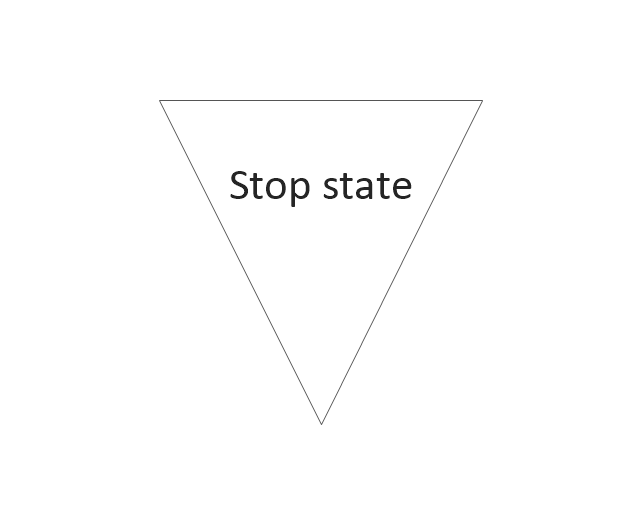
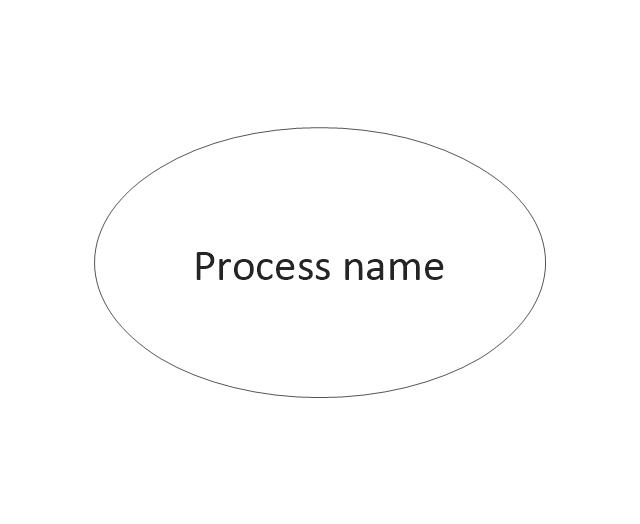
One of the three main constituents of any enterprise is the Control and Information Architecture. The rest two are Production facilities and People and Organization.The vector stencils library "DFD, Yourdon and Coad notation" contains 22 DFD elements.
Use it for drawing data flow diagrams (DFD) using Yourdon/ DeMarco notation in the ConceptDraw PRO diagramming and vector drawing software extended with the Data Flow Diagrams solution from the Software Development area of ConceptDraw Solution Park.
Use it for drawing data flow diagrams (DFD) using Yourdon/ DeMarco notation in the ConceptDraw PRO diagramming and vector drawing software extended with the Data Flow Diagrams solution from the Software Development area of ConceptDraw Solution Park.
- Data structure diagram with ConceptDraw PRO | Data Flow ...
- Data Flow Diagrams
- Data Flow Diagram
- Data Flow Diagram | Basic Flowchart Symbols and Meaning ...
- Data structure diagram with ConceptDraw PRO | Program Structure ...
- How To Draw Data Flow Diagram
- Visio Files and ConceptDraw | Process Flowchart | Data Flow ...
- Data Flow Diagrams | Rapid UML | UML Class Diagram Constructor ...
- Data Flow Diagram Model
- Data Flow Diagrams | Data structure diagram with ConceptDraw ...
- Data Flow Diagrams with ConceptDraw PRO | Design elements ...
- Data structure diagram with ConceptDraw PRO | Structured Systems ...
- Data Flow Diagram With Easy Business Example
- Data Flow Diagrams with ConceptDraw PRO
- Data Flow Diagrams | UML class diagram - Metadata information ...
- Taxi Service Data Flow Diagram DFD Example | UML Use Case ...
- Data Flow Diagram Symbols. DFD Library
- Data Flow Diagram | Software and Database Design with ...
- DFD Library System | Data Flow Diagrams | DFD Library - Design ...
- Data Flow Diagrams








-dfd,-yourdon-and-coad-notation---vector-stencils-library.png--diagram-flowchart-example.png)
