 Event-driven Process Chain Diagrams
Event-driven Process Chain (EPC) Diagram is a type of flowchart widely used for modeling in business engineering and reengineering, business process improvement, and analysis. EPC method was developed within the Architecture of Integrated Information Systems (ARIS) framework.
 Cross-Functional Flowcharts
Cross-functional flowcharts are powerful and useful tool for visualizing and analyzing complex business processes which requires involvement of multiple people, teams or even departments. They let clearly represent a sequence of the process steps, the order of operations, relationships between processes and responsible functional units (such as departments or positions).
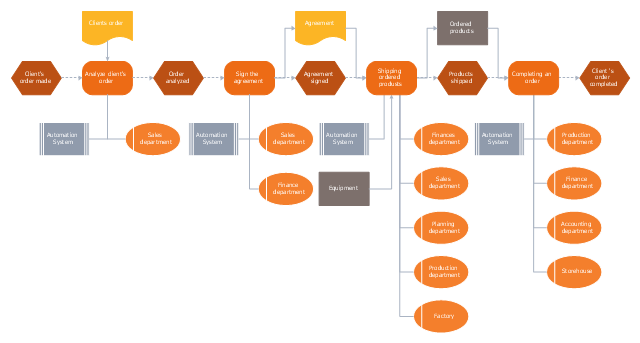
"Order processing is a key element of Order fulfillment. Order processing operations or facilities are commonly called "distribution centers". "Order processing" is the term generally used to describe the process or the work flow associated with the picking, packing and delivery of the packed item(s) to a shipping carrier. The specific "order fulfillment process" or the operational procedures of distribution centers are determined by many factors. Each distribution center has its own unique requirements or priorities. There is no "one size fits all" process that universally provides the most efficient operation." [Order processing. Wikipedia]
The business process modeling (BPM) flowchart example "Order processing - EPC flow chart" was created using the ConceptDraw PRO diagramming and vector drawing software extended with the Event-driven Process Chain Diagrams solution from the Business Processes area of ConceptDraw Solution Park.
The business process modeling (BPM) flowchart example "Order processing - EPC flow chart" was created using the ConceptDraw PRO diagramming and vector drawing software extended with the Event-driven Process Chain Diagrams solution from the Business Processes area of ConceptDraw Solution Park.
EPC flow chart
HelpDesk
How to Make a Logistics Flow Chart

- Order processing - Cross- functional flowchart | Order processing ...
- Swim Lane Flowchart Symbols | Cross- Functional Flowchart (Swim ...
- Order processing - EPC flow chart | Order processing - Cross ...
- PERT Chart Software | Process Flowchart | Gantt Chart Software ...
- Data Flow Diagram
- Cross- Functional Flowcharts | Basic Flowchart Symbols and ...
- Data Flow Diagram Architecture Example
- Process Flowchart | Flow chart Example. Warehouse Flowchart ...
- Swim Lane Diagrams | Swim Lane Flowchart Symbols | Cross ...
- Flow chart Example. Warehouse Flowchart | Flowchart Marketing ...
- Flowchart Marketing Process. Flowchart Examples | Marketing Flow ...
- Business Plan Flow Chart
- Basic Flowchart Symbols and Meaning | Process Flowchart | Data ...
- Swim Lane Diagrams | Process Flowchart | Data Flow Diagram ...
- Flow Chart Of Spa Operation Plan
- Process Flowchart | Event -driven Process Chain Diagrams | How Do ...
- Event Centre Plumbing Design
- Providing telecom services - Cross- functional flowchart ...
- Process Flowchart | Event -driven Process Chain Diagrams | How ...
- Process Flowchart | Sales Process Flowchart . Flowchart Examples ...