HelpDesk
How to Draw a Divided Bar Chart in ConceptDraw PRO
A divided bar graph is a rectangle divided into smaller rectangles along its length in proportion to the data. Segments in a divided bar represent a set of quantities according to the different proportion of the total amount. A divided bar diagram is created using rectangular bars to depict proportionally the size of each category. The bars in a divided bar graph can be vertical or horizontal. The size of the each rectangle displays the part that each category represents. The value of the exact size of the whole must be known, because the each section of the bar displays a piece of that value. A divided bar diagram is rather similar to a sector diagram in that the bar shows the entire data amount and the bar is divided into several parts to represent the proportional size of each category. ConceptDraw PRO in conjunction with Divided Bar Diagrams solution provides tools to create stylish divided bar charts for your presentations.Venn Diagram Template for Word
This template shows the Venn Diagram. It was created in ConceptDraw PRO diagramming and vector drawing software using the ready-to-use objects from the Venn Diagrams Solution from the "What is a Diagram" area of ConceptDraw Solution Park.Flowchart Maker
A flowchart maker is a software showing the interaction, sequence or organization. It also known as flowchart maker or ConceptDraw PRO standard supplied with different types of symbol collections: standard symbols, branded set and authored. It used strictly for enhancing scientific or business documents with abstract explanatory pictures.Business graphic applications show a special knowledge representations and include many features for creating schematic pictures. These graphic tools are known as flowchart maker or flowchart maker software.
Column Chart Template
Column chart templates from ConceptDraw collection can help you find the best visual depiction for you data. You can easily modify column chart templates according to data you want to visualize.Chart Examples
Easy charting software comes with beautiful chart templates and examples. This makes it easy to create professional charts without prior experience.Social Media Flowchart Symbols
Social media is a popular view of mass communication which allows people, companies and organizations create, share, discover, modify, access, comment, discuss and exchange information through the Internet. Social Media Response solution for ConceptDraw PRO provides collection of 10 libraries with diversity of predesigned vector social media flowchart symbols for fast and easy creating interactive Social Media Flowcharts, Response Charts and Action Mind Maps.Organizational Chart Templates
ConceptDraw offers you a number of ready-made organizational chart templates which you can use in your drawing. They are grouped in topical sets as organizational chart template files.Use the Organizational Charts Solution for ConceptDraw PRO to create your own Organizational Charts of any complexity quick, easy and effective.
The Organizational Charts designed with ConceptDraw PRO are vector graphic documents and are available for reviewing, modifying, converting to a variety of formats (image, HTML, PDF file, MS PowerPoint Presentation, Adobe Flash or MS Visio XML), printing and send via e-mail in one moment.

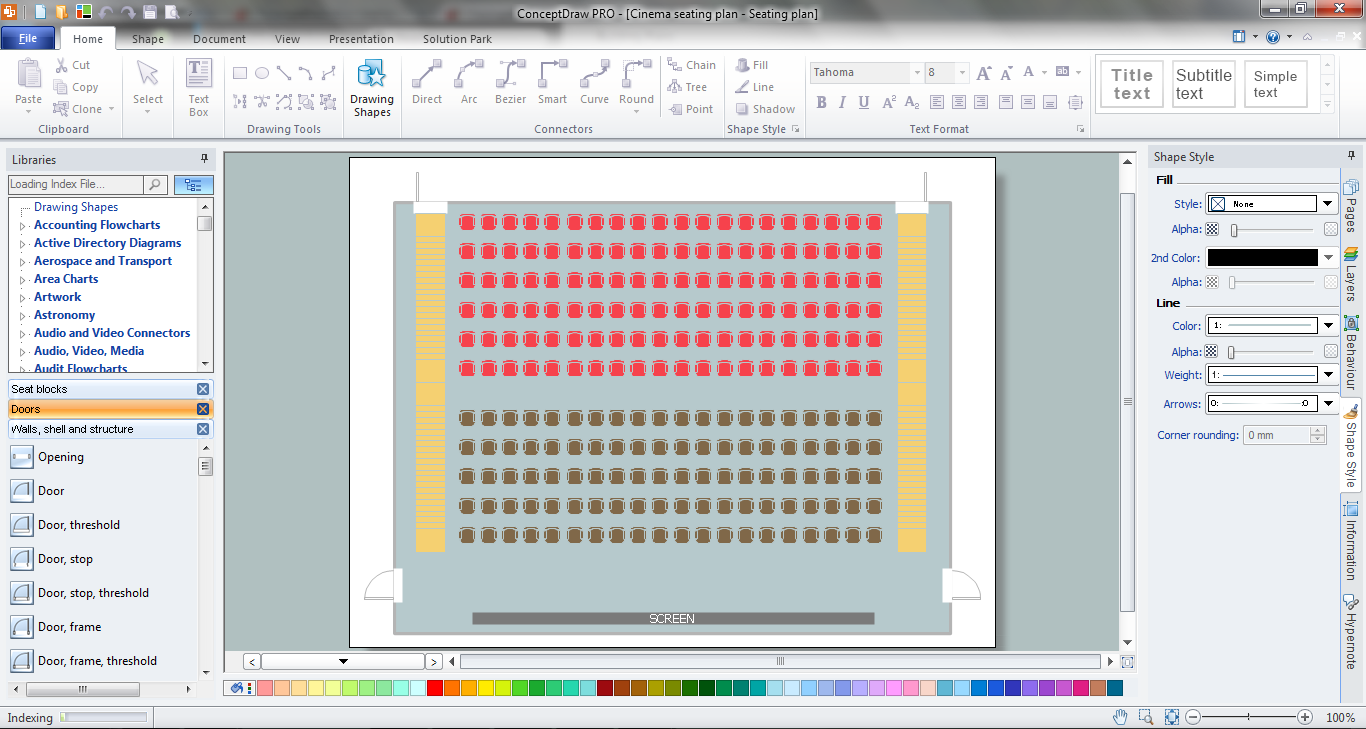
Seating Chart Template Free
You need design the seating chart? The simple way is to use the specialized software. ConceptDraw PRO diagramming and vector drawing software extended with Seating Plans solution from the Building Plans area with powerful drawing tools, samples, seating chart template free will be ideal for you.- SYSML | Steps Of Sub Divided Bar Diagram
- How to Draw a Divided Bar Chart in ConceptDraw PRO | Divided ...
- How To Make Sub Divided Rectangular Diagram
- Sub Divided Bar Diagram With Schedule
- How To Make Sub Divided Graph
- Subdivided Bar Diagram Examples
- Subdivided Bar Diagram
- Divided Rectangular Diagram
- Bar Diagram Math | Process Flow Diagram | Divided Bar Diagrams ...
- Divided Bar Diagrams | Design elements - Composition charts and ...
- Making Process Of Rectangular Diagram In Geography
- Percentage Pie Chart. Pie Chart Examples | Basic Diagramming ...
- Example Questions Of Sub Devided Bar Graph
- How to Create a Pyramid Diagram | Chart Examples | Chart ...
- Arrow circle chart - Template | Pie Chart Examples and Templates ...
- How To Draw Sub Divided Bar Graph
- Example Of A Percentage Bar Diagram
- Pie Chart Examples and Templates | Circle Spoke Diagram ...
- Divided Bar Graph Template
- The Diagram Of The Business Sector And Its Examples


