Swim Lane Flowchart Symbols

Flowchart Software


How to Simplify Flow Charting — Cross-functional Flowchart

SDL Flowchart Symbols

Software Work Flow Process in Project Management with Diagram

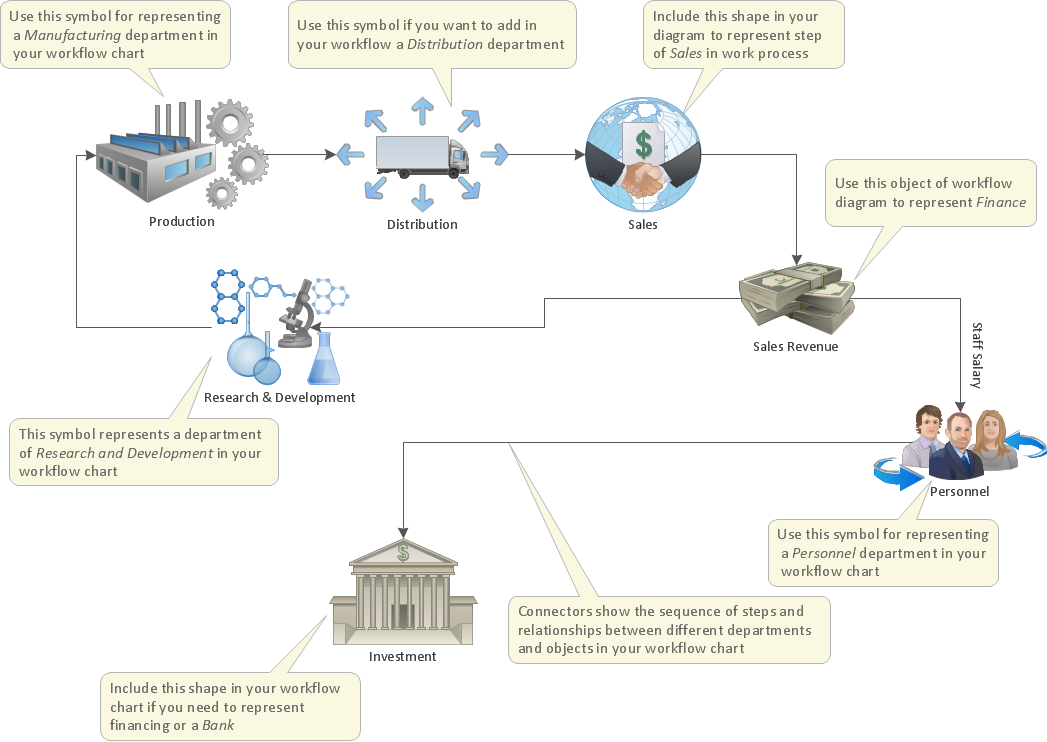
This sample shows the Workflow Diagram that clearly illustrates stages a BPM consists of and relations between all parts of business. The Workflow Diagrams are used to represent the transferring of data during the work process, to study and analysis the working processes, and to optimize a workflow.
Business Process Flow Diagram

Tools and Software to Improve Your Workflow

Work Process
Work Order Process Flowchart. Business Process Mapping Examples

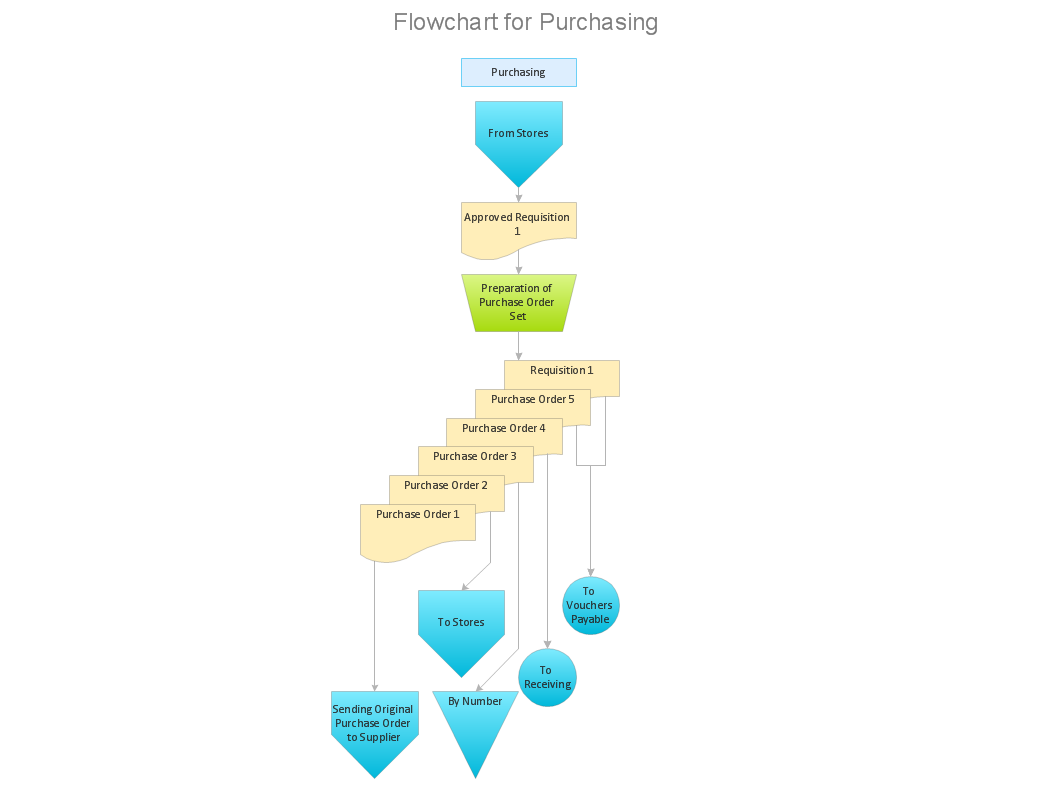
Workflow to Make a Purchase. Accounting Flowchart Example
Workflow Diagram Data

Express-G Diagram

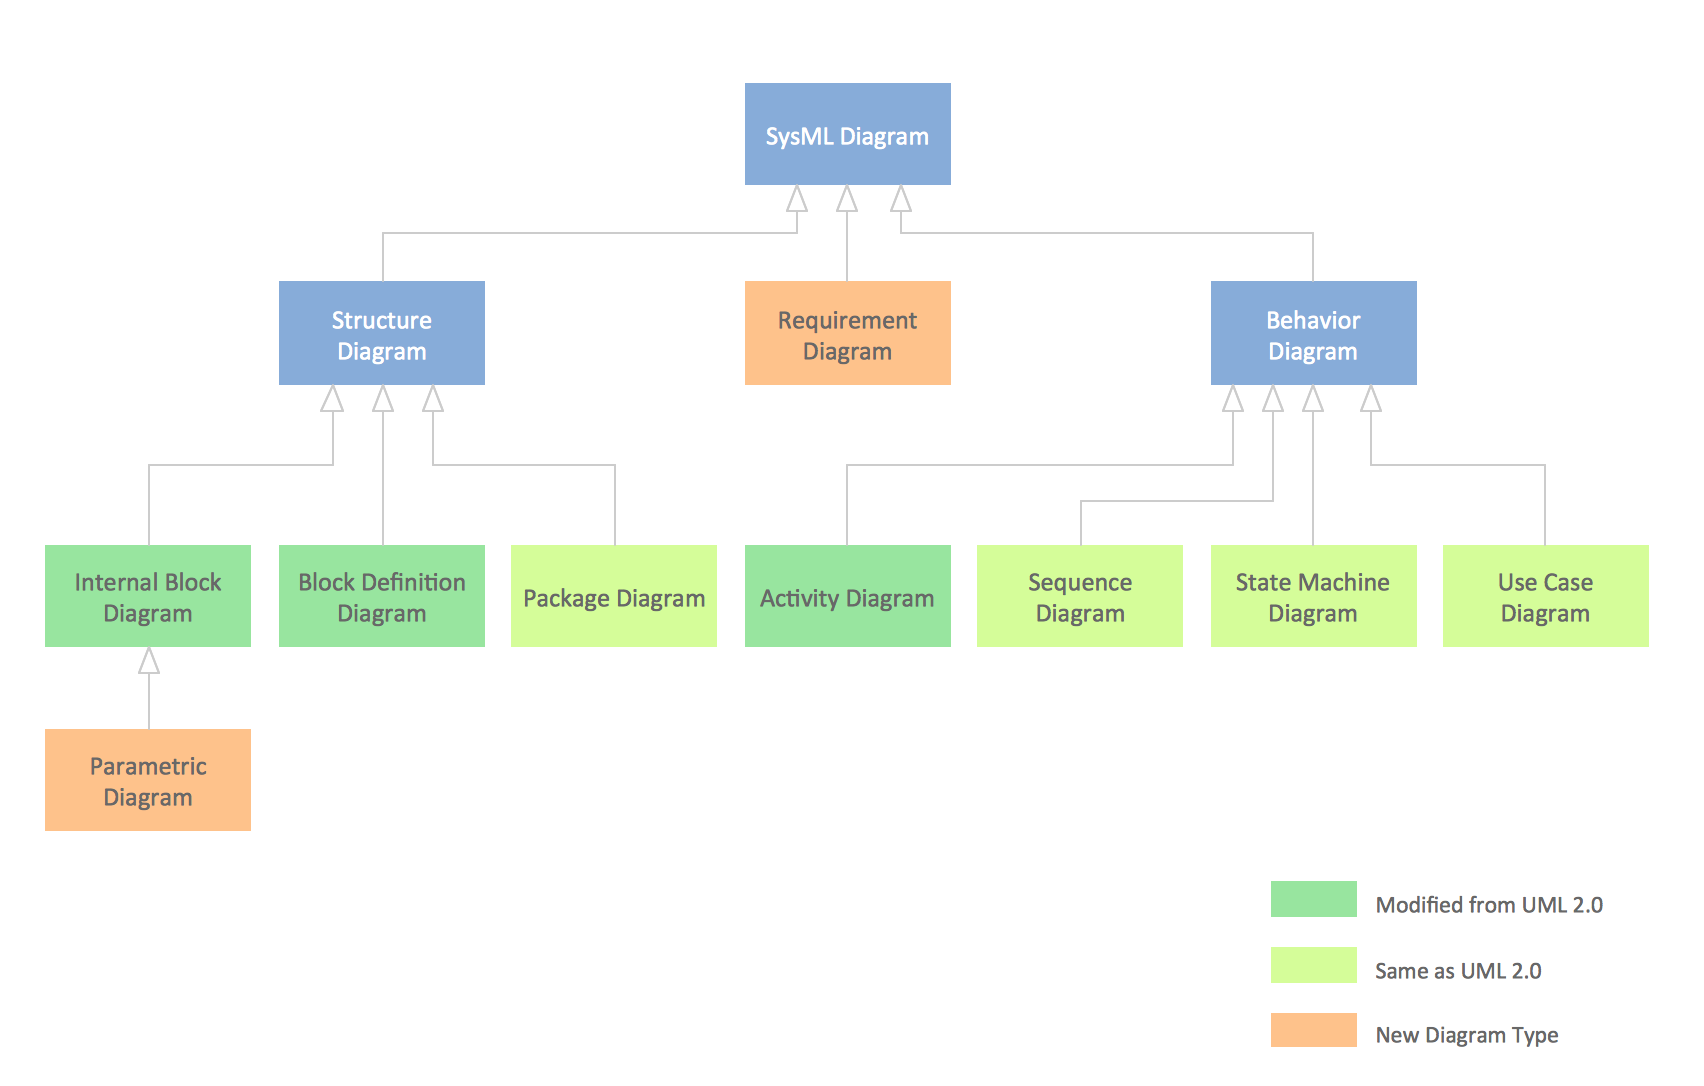
SysML

Venn Diagram Examples for Problem Solving. Computer Science. Chomsky Hierarchy

SysML Diagram
- Process Flowchart | Basic Flowchart Symbols and Meaning | Data ...
- Process Flowchart | Work Flow Process Chart | Basic Flowchart ...
- Basic Flowchart Symbols and Meaning | Cross Functional Flowchart ...
- Basic Flowchart Symbols and Meaning | Workflow Diagram ...
- Business Requirements Document Process Flow
- Document Flow Chart Used In A Warehouse
- Simple Flow Chart | Process Flowchart | Basic Flowchart Symbols ...
- Management Flow Chart Template
- Flow Chart Of Company Departments
- Basic Flowchart Symbols and Meaning | Types of Flowcharts | Types ...
- Swim Lane Diagrams | Swim Lane Flowchart Symbols | Swim Lanes ...
- Basic Flowchart Symbols and Meaning | Flow Chart Symbols ...
- Process Flowchart | Process Flow Diagram Symbols | How to Draw a ...
- Workflow Diagram Examples | Flow chart Example. Warehouse ...
- Process Flowchart | Workflow Diagram Template | Software Work ...
- Process Flowchart | Flowchart Software | Basic Flowchart Symbols ...
- Process Flowchart | Basic Flowchart Symbols and Meaning | Flow ...
- Basic Flowchart Symbols and Meaning | Drawing Workflow ...
- Workflow Diagram Template | Basic Flowchart Symbols and ...
- Basic Flowchart Symbols and Meaning | Technical Flow Chart ...