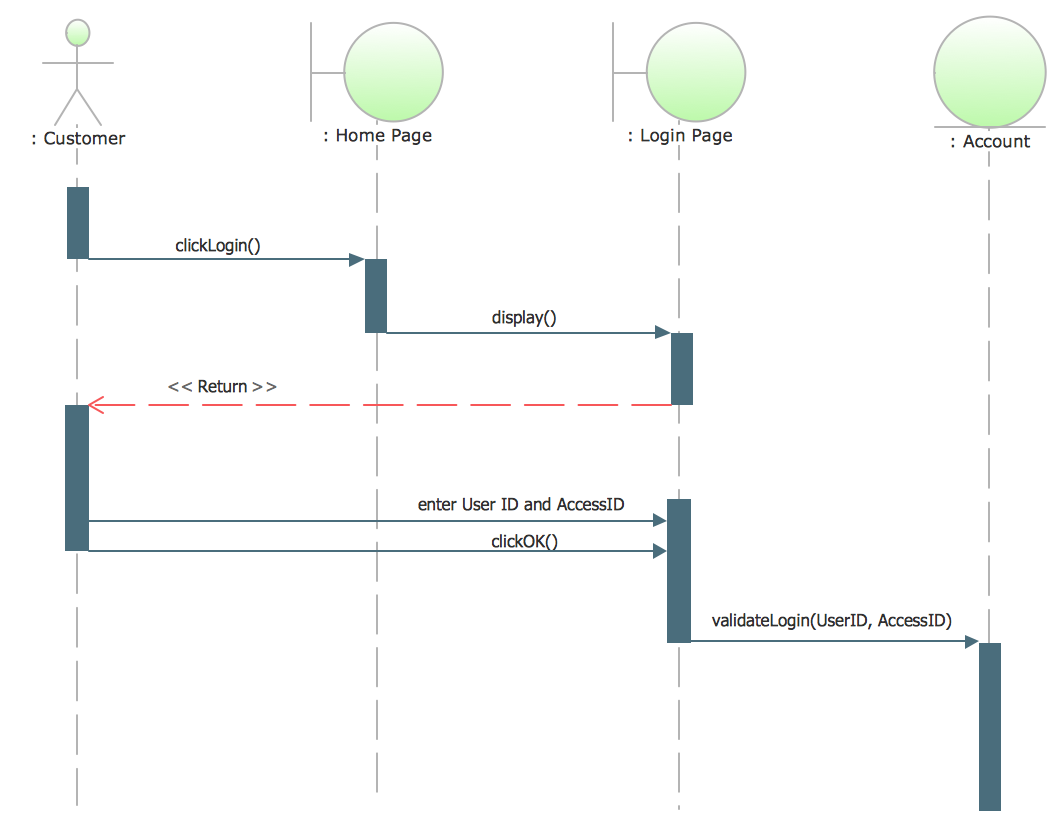
UML Sequence Diagram Example. SVG Vectored UML Diagrams Tools
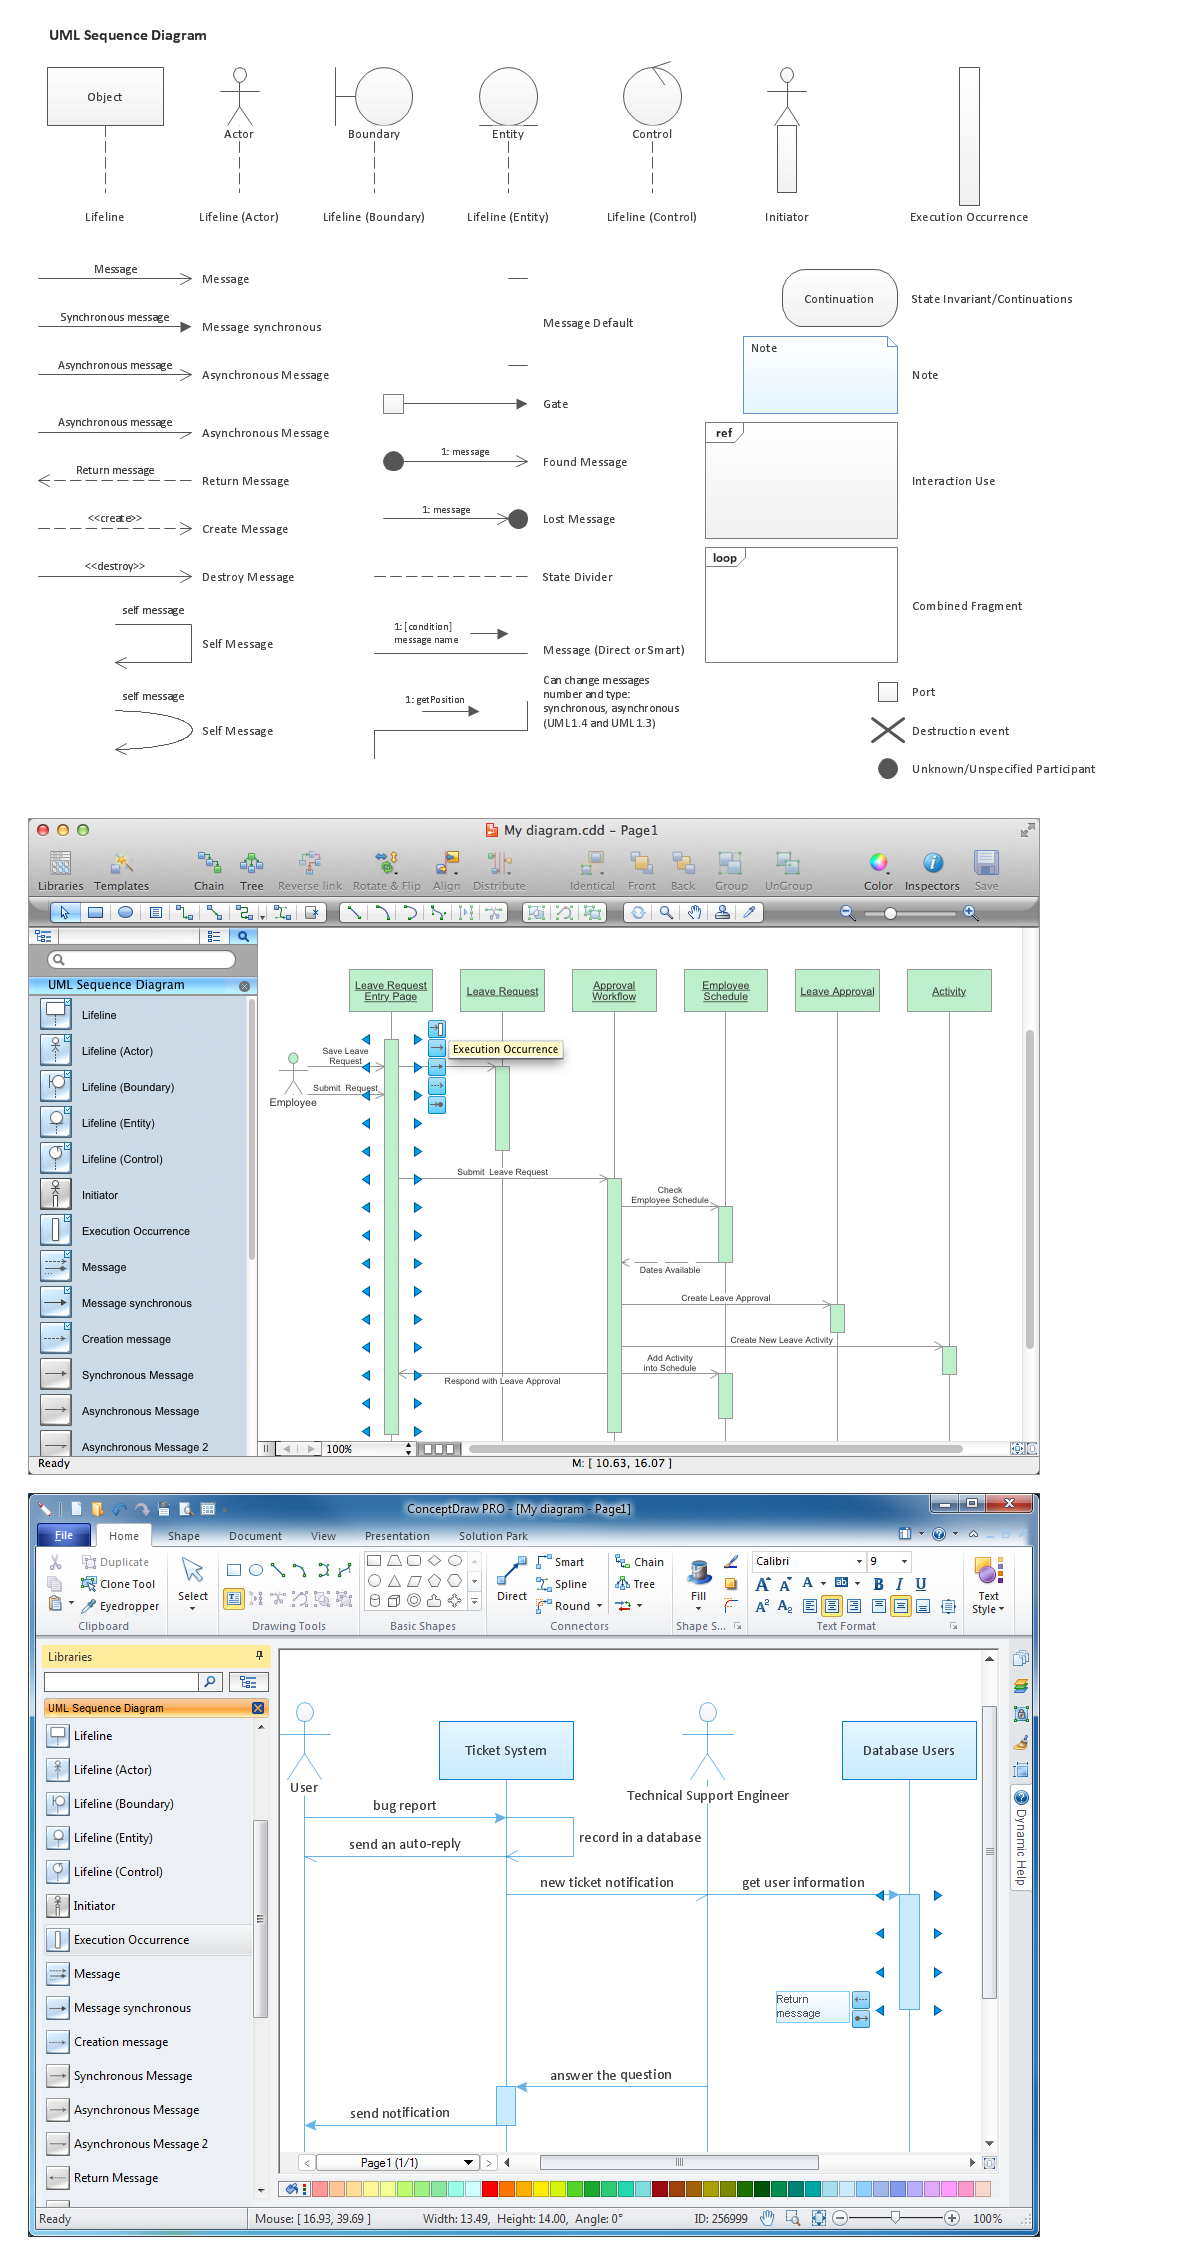
This sample was created in ConceptDraw PRO diagramming and vector drawing software using the UML Sequence Diagram library of the Rapid UML Solution from the Software Development area of ConceptDraw Solution Park. This sample shows the interactions of the customer with the system and is used at the registration on the sites.How to draw Metro Map style infographics? Moscow, New York, Los Angeles, London
The solution handles designs of any complexity, and the comprehensive library covers all key aspects of a transportation system. To further enhance your map design, there is the option to embed links, that can display station images or other relevant, important information. We have also included a set of samples in the solution, that show the possible real-world application — complex tube systems including the London Tube and New York City Subway show the level of detail possible when using the Metro Map Solution.HelpDesk
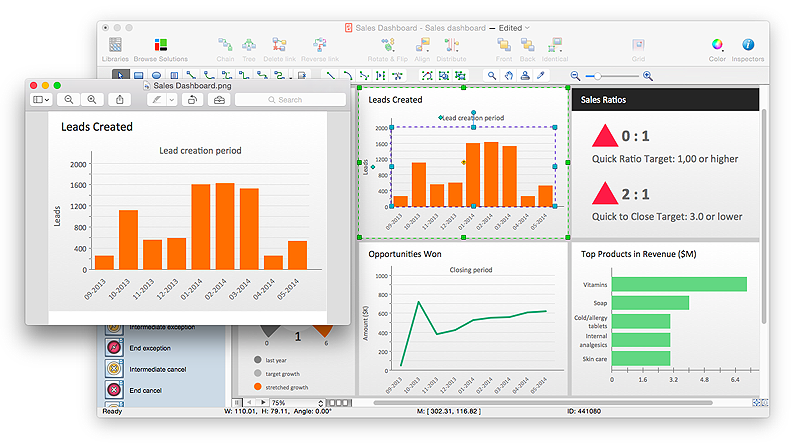
How to Save a Drawing as a Graphic File in ConceptDraw PRO
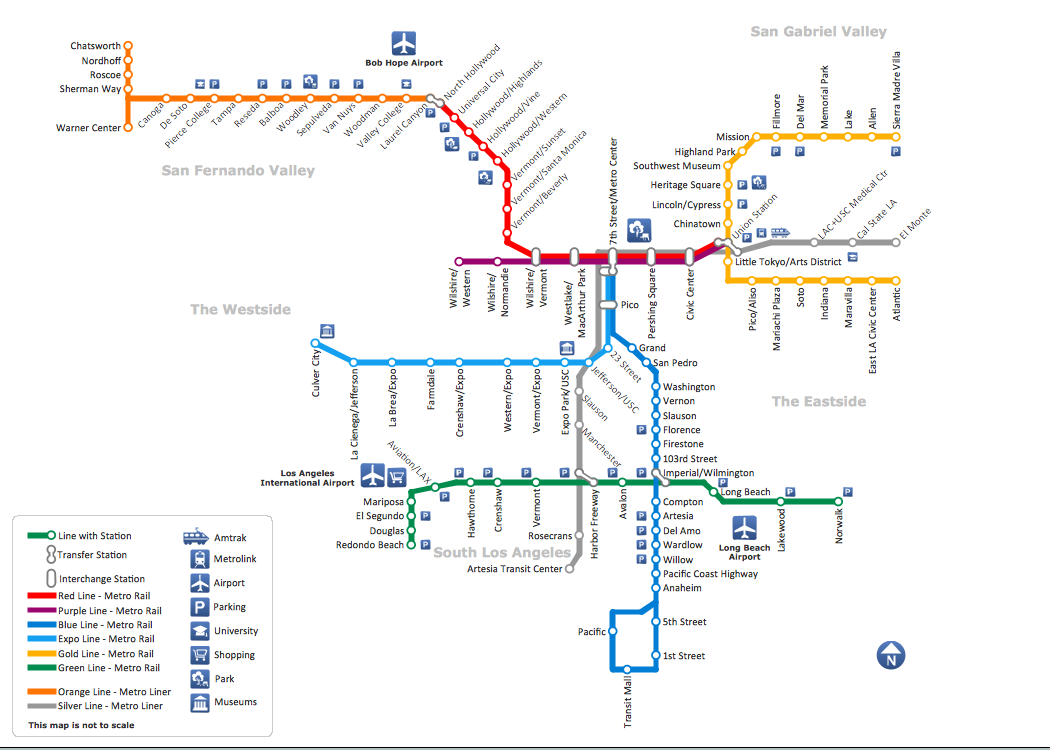
ConceptDraw PRO can save your drawings and diagrams in a number of highly useful formats, including graphic files. You can save your drawing as a .PNG, .JPG, or other graphic format file.How to draw Metro Map style infographics? (Los Angeles)
Tool to draw Metro Map styled inforgraphics. Los Angeles Metro Rail and Liner sample. This is a one-click tool to add stations to the map. It lets you control the direction in which you create new stations, change lengths, and add text labels and icons. It contains Lines, Stations, and Landmarks objects.Pyramid Diagram
The Project Management Triangle Diagram depicts three main constraints of any project: scope, time and cost. Projects have to comply with the specified scope, projects should be finished in time and projects need to consume the budget. Each of the constraints represents one side of the triangle, and any change in budget or timing or scope affects the entire diagram. This diagram was made using ConceptDraw Office suite including best marketing project management software extended with collection of tools for creative project management software and project management reporting software symbols.UML Collaboration Diagram Example Illustration
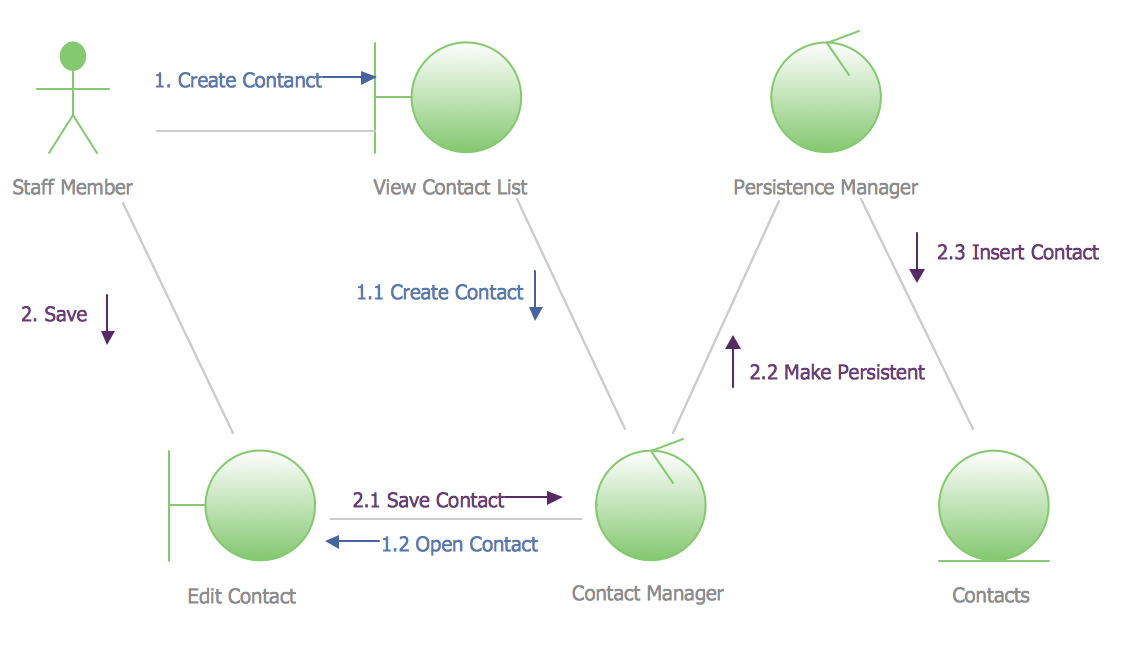
UML Collaboration Diagram Example Illustration. This sample was created in ConceptDraw PRO diagramming and vector drawing software using the UML Collaboration Diagram library of the Rapid UML Solution from the Software Development area of ConceptDraw Solution Park. This sample shows the creation process of the contact list and can be used at the staff training and staff working, at the attraction process the new clients.Pyramid Diagram
A Venn-diagram style chart of the "project triangle" showing visually the potential overlaps between speed, quality and low cost, along with the "inability" to accomplish all three.Pyramid Diagram
A triangular graphic representing Graham's "hierarchy of disagreement", based on Paul Graham's March 2008 essay "How to Disagree".DroidDia prime
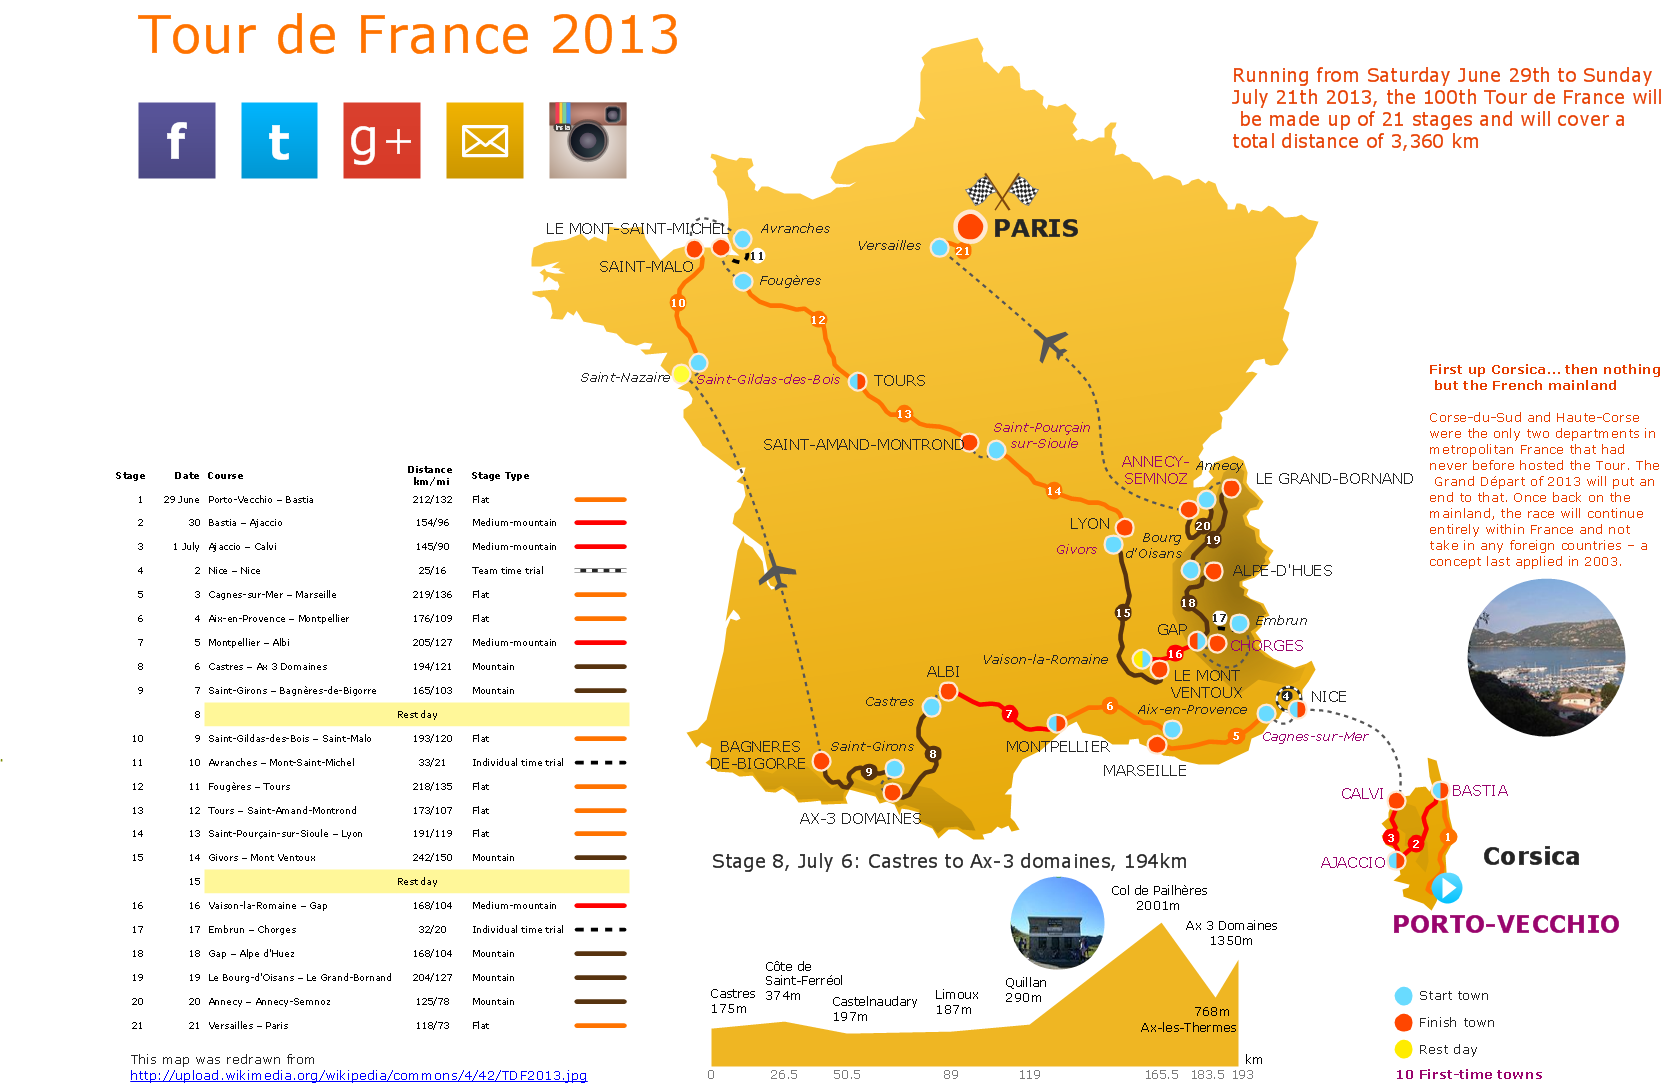
Droiddia allows you to make flow charts org charts venn diagrams mindmaps and do other diagrams with no constrains and as little effort as possible.Superb Examples of Infographic Maps
Great examples of Infographic Maps, they are needed for inspiration.Diagramming Software for designing UML Sequence Diagrams
Sequence Diagrams shows how objects communicate with each other in terms of a sequence of messages. Also indicates the lifespans of objects relative to those messages.
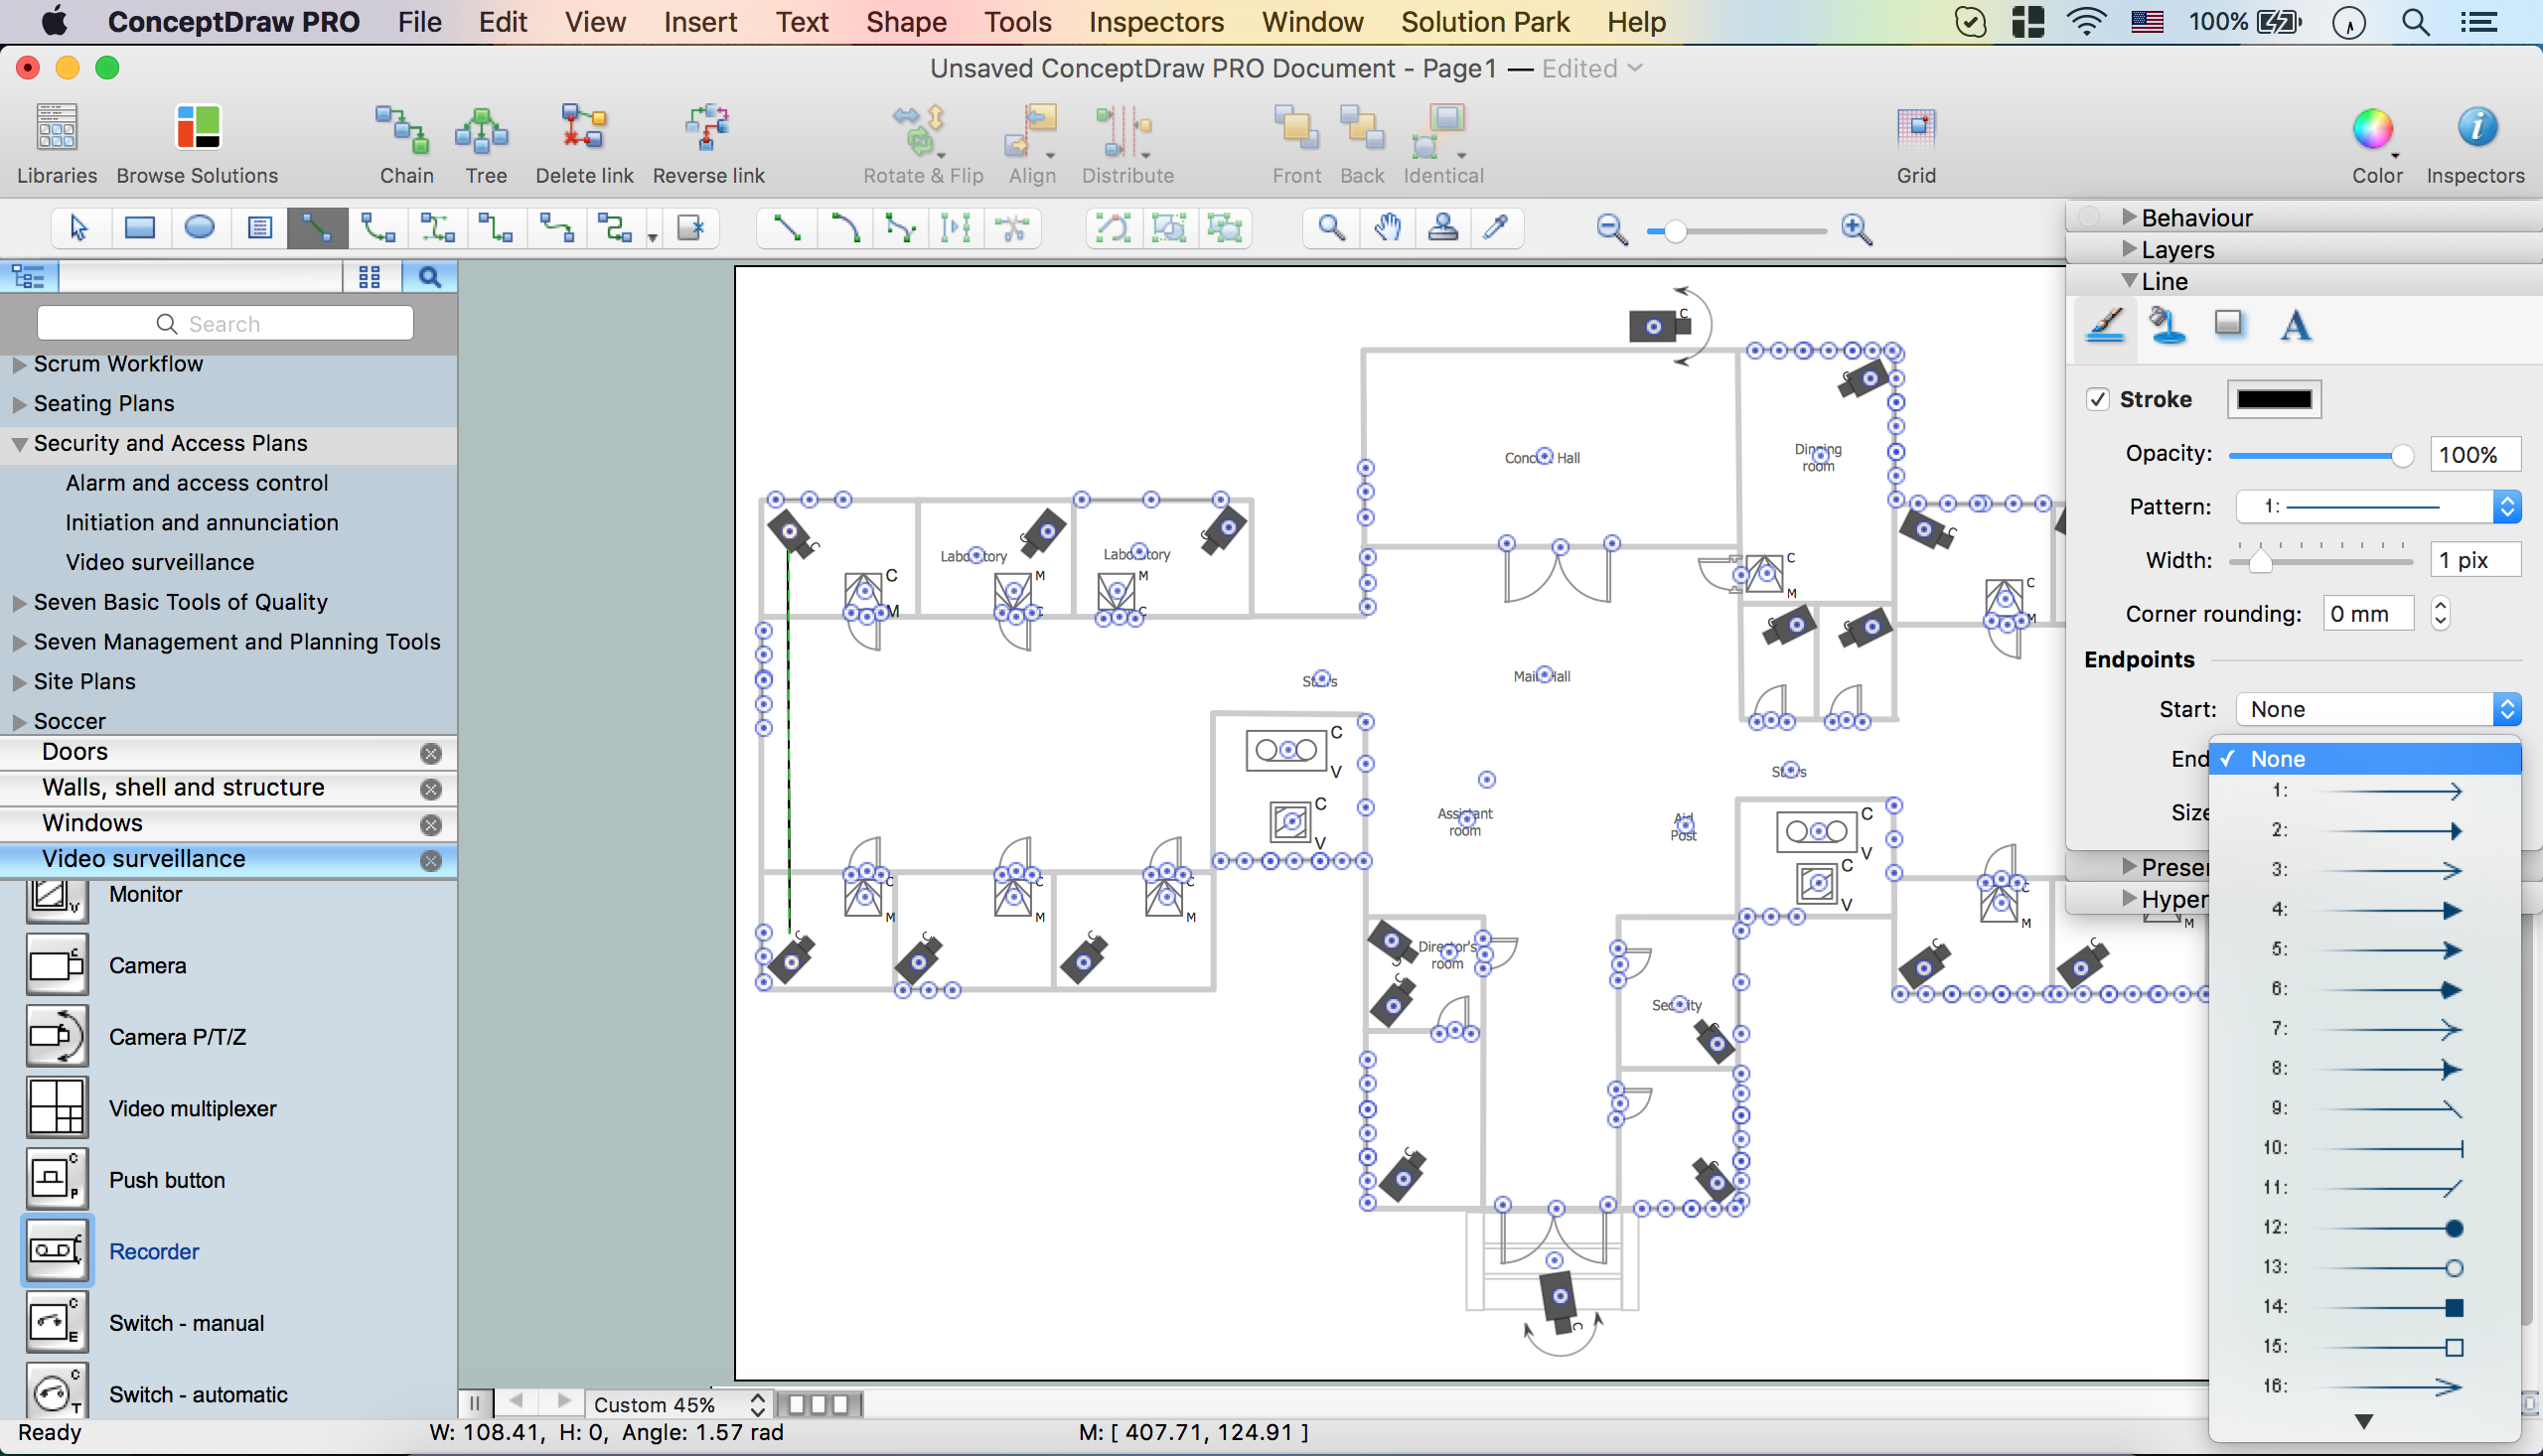
How To Create CCTV Network Diagram
Closed-circuit television (CCTV) uses cameras and monitors to carry out video surveillance. Unlike broadcast television this system has only local signal. It is a feature of almost every video camera, yet CCTV is mainly a system for visual control of certain areas such as banks, airports, supermarkets, and other places for security reasons. Developing and installing CCTV system is a time-consuming process. It also requires certain knowledge and skills. ConceptDraw is a solution of setting video cameras rationally. You can achieve two aims at once: CCTV Design Tool saves your time and your money and helps you make professional video surveillance system.Diagramming tool - Amazon Web Services and Cloud Computing Diagrams
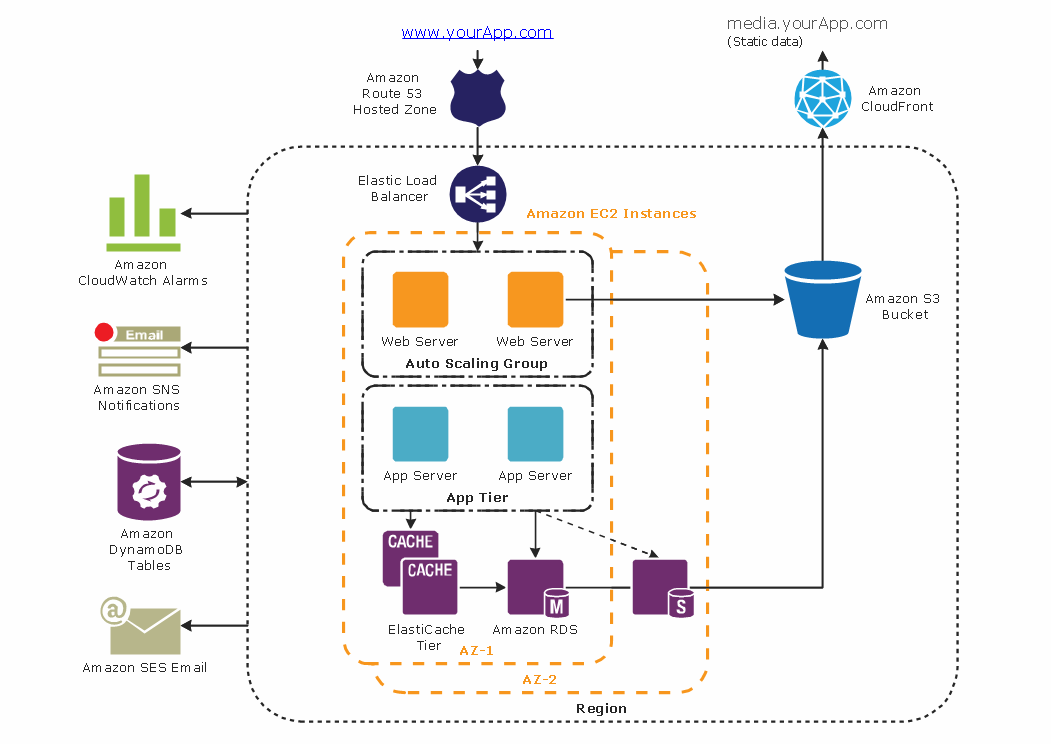
The AWS Architecture Diagrams solution includes icons, sample and templates for several Amazon Web Services products and resources, to be used when creating architecture diagrams. The icons are designed to be simple so that you can easily incorporate them in your diagrams and put them in your whitepapers, presentations, datasheets, posters or any technical material you like."Citric acid cycle (tricarboxylic acid cycle, TCA cycle, Krebs cycle) is a series of chemical reactions used by all aerobic organisms to generate energy through the oxidation of acetate derived from carbohydrates, fats and proteins into carbon dioxide and chemical energy in the form of adenosine triphosphate (ATP)." [Citric acid cycle. Wikipedia]
This biochemical diagram example shows metabolic pathways map of citric acid cycle reactions.
This sample was redesigned from the Wikimedia Commons file: TCA cycle.svg. [commons.wikimedia.org/ wiki/ File:TCA_ cycle.svg]
This image is licensed under the Creative Commons Attribution 3.0 Unported license. [creativecommons.org/ licenses/ by/ 3.0/ deed.en]
The metabolic pathway map example "Citric acid cycle (TCA cycle)" was created using the ConceptDraw PRO diagramming and vector drawing software extended with the Biology solution from the Science and Education area of ConceptDraw Solution Park.
- Tca Cycle Images
- Glycolysis Cycle Pathwey Hd Image
- Krebs Cycle Images
- Image Diagram Of Citric Acid Cycle
- UML Sequence Diagram Example. SVG Vectored UML Diagrams ...
- Citric Acid Cycle Image
- Kreb Cycle Image
- Hd Image Of Tca Cycal
- Flags Svg
- Geo Map - South America - Peru | Geo Map of Americas | Mapa ...
- Citric acid cycle (TCA cycle) | Illustration Software | Physics Symbols ...
- Australia Svg
- Citric acid cycle (TCA cycle) | Design elements - TCA cycle | Biology ...
- Design elements - TCA cycle | Citric acid cycle (TCA cycle) | Biology ...
- Mouse Svg
- Flowchart Svg
- Fire Exit Plan | Emergency Plan | Hotel Floorplan | Fire Exit Images
- Mountain Svg
- Png Images Of Water Cycle
- Bar Diagrams for Problem Solving. Create space science bar charts ...




.jpg)
.png--diagram-flowchart-example.png)