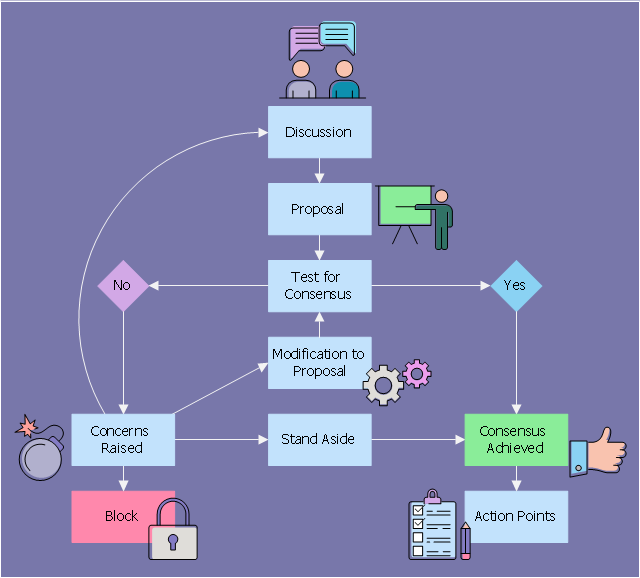
This flowchart example illustrates the consensus based decision-making.
It was designed on the base of Wikimedia Commons file: Consensus flow chart.svg. [commons.wikimedia.org/ wiki/ File:Consensus_ flow_ chart.svg]
"Consensus decision-making is a group decision-making process in which group members develop, and agree to support a decision in the best interest of the whole. Consensus may be defined professionally as an acceptable resolution, one that can be supported, even if not the "favourite" of each individual. ... Consensus decision-making is thus concerned with the process of deliberating and finalizing a decision, and the social, economic, legal, environmental and political effects of applying this process." [Consensus decision-making. Wikipedia]
This file is licensed under the Creative Commons Attribution-Share Alike 3.0 Unported license. [creativecommons.org/ licenses/ by-sa/ 3.0/ deed.en]
The decision diagram example "Consensus flow chart" was designed using ConceptDraw software extended with Decision Making solution from Management area of ConceptDraw Solution Park.
Decision diagram example
 Business Process Workflow Diagrams
The Business Process Workflow Diagrams solution enhances the ConceptDraw DIAGRAM functionality with predesigned examples, samples and a numerous collection of predesigned vector objects of workflow chart elements, icons, arrows, connectors, and varied wor
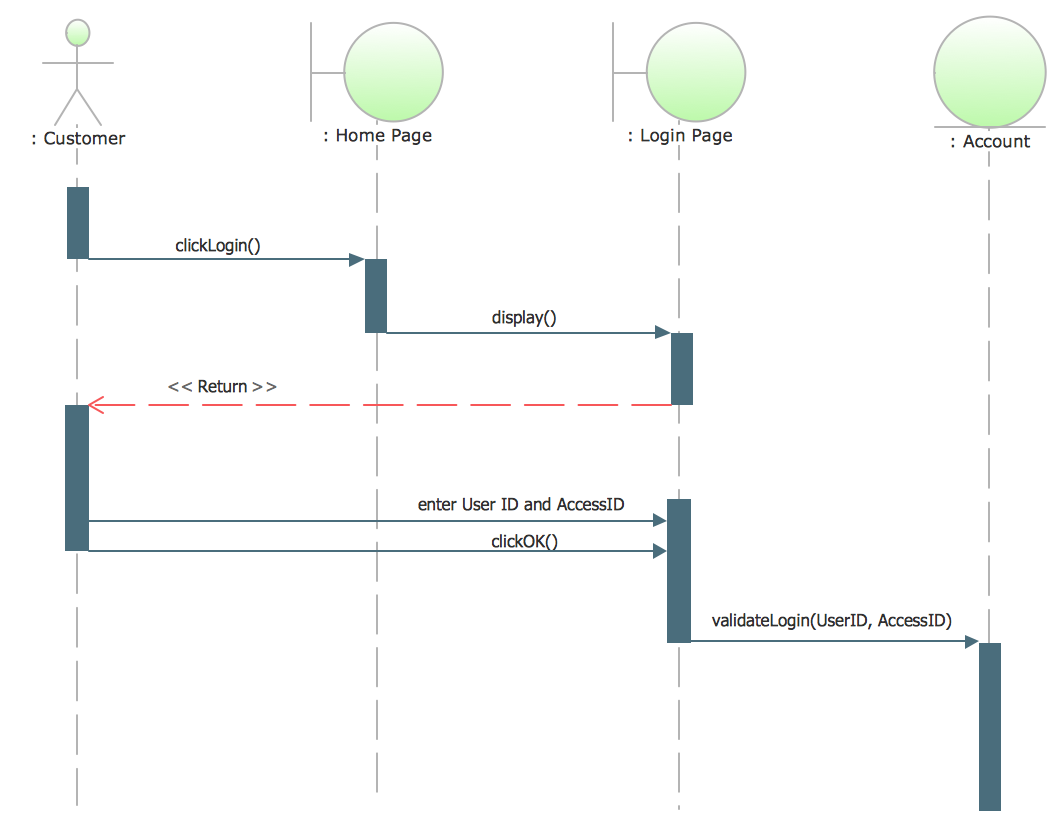
UML Sequence Diagram Example. SVG Vectored UML Diagrams Tools
Flow Diagram Software

Process Flow Chart Software Free

Business Process Flowchart Symbols

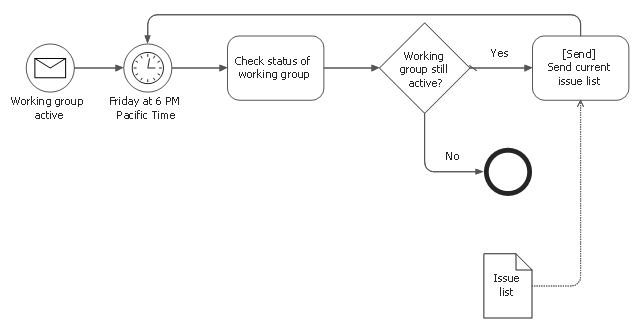
This BPMN diagram sample was designed on the base of the Wikimedia Commons file: BPMN-AProcesswithNormalFlow.svg. [commons.wikimedia.org/ wiki/ File:BPMN-AProcesswithNormalFlow.svg]
"Business process modelling (BPM) is the activity of representing processes of an enterprise, so that the current ("as is") process may be analyzed and improved in future ("to be"). Business process modelling is typically performed by business analysts and managers who are seeking to improve process efficiency and quality. The process improvements identified by business process modelling may or may not require Information Technology involvement, although that is a common driver for the need to model a business process, by creating a process master.
Change management programs are typically involved to put the improved business processes into practice. With advances in technology from large platform vendors, the vision of business process modelling models becoming fully executable (and capable of simulations and round-trip engineering) is coming closer to reality every day." [Enterprise modelling. Wikipedia]
The business process diagram example "A process with normal flow" was created using the ConceptDraw PRO diagramming and vector drawing software extended with the Business Process Model and Notation solution from the Business Processes area of ConceptDraw Solution Park.
BPMN diagram
Flowchart design. Flowchart symbols, shapes, stencils and icons


Flow Chart Online

 Event-driven Process Chain Diagrams
Event-Driven Process Chain Diagrams solution extends ConceptDraw DIAGRAM functionality with event driven process chain templates, samples of EPC engineering and modeling the business processes, and a vector shape library for drawing the EPC diagrams and EPC flowcharts of any complexity. It is one of EPC IT solutions that assist the marketing experts, business specialists, engineers, educators and researchers in resources planning and improving the business processes using the EPC flowchart or EPC diagram. Use the EPC solutions tools to construct the chain of events and functions, to illustrate the structure of a business process control flow, to describe people and tasks for execution the business processes, to identify the inefficient businesses processes and measures required to make them efficient.
- Svg Symbols Process Flow Diagram
- Pyramid Diagram | Lead to opportunity sales flow | Process Flow ...
- DroidDia prime | Lead to opportunity sales flow | Pyramid Diagram ...
- Flow Chart Symbols Svg
- Lead to opportunity sales flow | Process flow diagram - Typical oil ...
- Active indirect water heater diagram | Pump Diagram With Name
- Invoice lifecycle | Lead to opportunity sales flow | Sales Flowcharts ...
- Draw The Flow Chart Of Glycolytic Pathway
- Draw And Label The Diagram Of Glycolysis
- Crm Flow Chart