Venn Diagram Examples for Problem Solving

Venn Diagram Examples for Problem Solving. Venn Diagram as a Truth Table

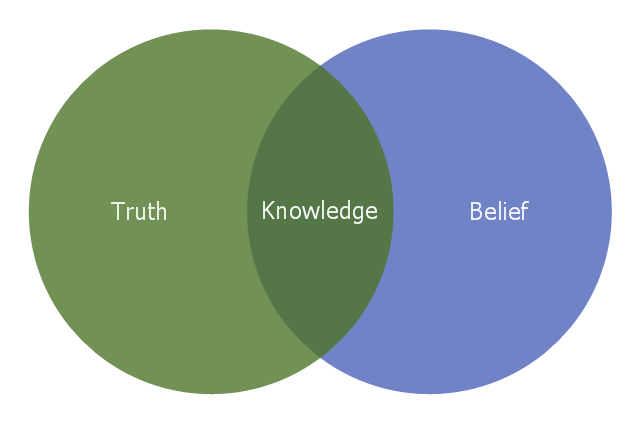
This Venn diagram sample illustrates the Plato's definition of knowledge. It was designed on the base of the Wikimedia Commons file: Belief Venn diagram.svg. [commons.wikimedia.org/ wiki/ File:Belief_ Venn_ diagram.svg]
"Justified true belief is a definition of knowledge that is most frequently credited to Plato and his dialogues. The concept of justified true belief states that in order to know that a given proposition is true, one must not only believe the relevant true proposition, but one must also have justification for doing so. In more formal terms, a subject S knows that a proposition P is true if and only if:
(1) P is true,
(2) S believes that P is true, and
(3) S is justified in believing that P is true" [Justified true belief. Wikipedia]
The Venn diagram example "Knowledge" was created using the ConceptDraw PRO diagramming and vector drawing software extended with the Venn Diagrams solution from the area "What is a Diagram" of ConceptDraw Solution Park.
Venn diagram
Pyramid Diagram

Pyramid Diagram

Program Structure Diagram

Pyramid Diagram

Best Vector Drawing Application for Mac OS X

Software Diagrams

The Best Flowchart Software Available


Best Flowcharts

Best Diagramming Software for macOS


 Website Wireframe
The innovative Website Wireframe solution enhances the ConceptDraw DIAGRAM functionality with newest wireframe tools, libraries with variety of predesigned icons, symbols, buttons, graphics, forms, boxes, and many other vector elements, templates and professionally designed samples, which make it the best wireframing software. Website Wireframe solution gives you significant advantages when designing and maintaining websites, creating skeletal and content-free depictions of website structure, making website prototypes and planning the content arrangement before committing to design, also speeds up the processes of sketching, producing and sharing wireframe examples of website style and interface design.
- Venn Diagrams | Venn Diagram Examples for Problem Solving ...
- Diagram Venn Svg
- 2-bit ALU - Logic gate diagram | Venn Diagram Examples for ...
- DroidDia prime | Lead to opportunity sales flow | Pyramid Diagram ...
- Venn Diagram Examples for Problem Solving . Environmental Social ...
- Knowledge - Venn diagram | Venn Diagram Examples for Problem ...
- Venn Diagram Examples | Photooxygenation | Venn Diagram Maker ...
- Venn diagram - Path to sustainable development | Sustainable ...
- Venn Diagram Examples for Problem Solving . Environmental Social ...
- UML Sequence Diagram Example . SVG Vectored UML Diagrams ...
- Venn Diagram Template for Word | Venn Diagrams | Venn Diagram ...
- Venn Diagram Examples for Problem Solving . Venn Diagram as a ...
- Venn Diagram Examples for Problem Solving . Environmental Social ...
- Venn Diagram Examples for Problem Solving . Environmental Social ...
- UML Sequence Diagram Example . SVG Vectored UML Diagrams ...
- Venn Diagram Examples for Problem Solving . Venn Diagram as a ...
- McKinsey 7S framework - Bubble diagram | Global cumulative ...
- UML Sequence Diagram Example . SVG Vectored UML Diagrams ...
- Sustainable development | Sustainable Development Svg
- 3 Circle Venn Diagram . Venn Diagram Example | Multi Layer Venn ...