Cross-Functional Flowchart
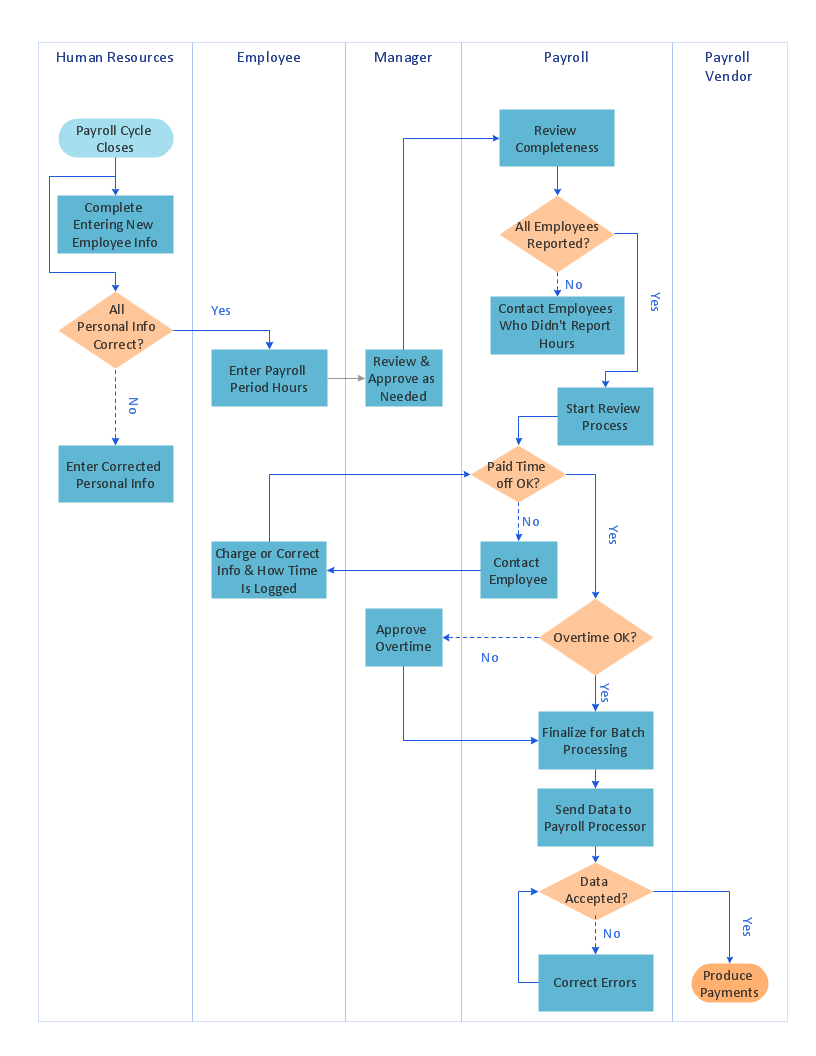
Use of Cross-Functional Flowchart is a clear way of showing each team member’s responsibilities and how processes get shared or transferred between different responsible people, teams and departments. Use the best flowchart maker ConceptDraw PRO with a range of standardized cross-functional flowchart symbols to create the Cross-Functional Flowcharts simply and to visualize the relationship between a business process and the functional units responsible for that process. To draw the most quickly Cross-Functional Flowcharts, Cross Functional Process Maps, or Cross Functional Process Flow Diagrams, start with a Cross-functional flowchart samples and templates from ConceptDraw Solution Park. The ConceptDraw Arrows10 and RapidDraw technologies will be also useful for you in drawing. ConceptDraw PRO supports designing both types - horizontal and vertical Cross-functional flowcharts. A vertical layout makes the accents mainly on the functional units while a horizontal layout - on the process. If you need a Visio alternative in Mac OS X, try ConceptDraw PRO. Its interface is very intuitive and it’s actually much easier to use than Visio, yet somehow it’s just as powerful if not more so. ConceptDraw PRO performs professional quality work and seamless Visio interaction.
Work Order Process Flowchart. Business Process Mapping Examples
The business process is a set of actions or tasks which are undertaken by an organization for production some goods or services, they are then offered for the customers and are ordered by them. Process Flowcharts and Order Process Flowcharts are sufficiently prevalent, well known and actively used in variety of fields of life, business and science. They are constructed using the common standardized symbols, thus are clear and understandable for all. They help effectively represent the processes, determine the order in which the process activities happen, document the order processes, and also effectively analyze the processes with a goal to increase their efficiency. Create your own Process Flowcharts, Order Process Flowcharts, Cross-Functional Flow Charts representing the order processing steps using powerful drawing tools of ConceptDraw PRO software and variety of predesigned vector objects from the libraries of Business Process Mapping Solution from Business Processes area of ConceptDraw Solution Park.How to draw a Cross-Functional Flowchart
Is it possible to develop a diagram as quickly as the ideas come to you? The innovative ConceptDraw Arrows10 Technology included in ConceptDraw PRO is a powerful drawing tool that changes the way diagrams are produced. While making the drawing process easier and faster.How to Dramatically Reduce Drawing Time - New connection modes
The innovative ConceptDraw Arrows10 Technology included in ConceptDraw PRO is a powerful drawing tool that changes the way diagrams are produced. While making the drawing process easier and faster. This is more than enough versatility to draw any type of diagram with any degree of complexity.ConceptDraw Arrows10 Technology
With ConceptDraw Arrows10 Technology - You can delete a single connector, by using the Delete key. If you need to delete more than a single connector in a complex diagram that contains many relations there is a special Delete Links tool which deletes the connectors only, no other drawing objects are deleted.Social Media Flowchart Symbols
Social media is a popular view of mass communication which allows people, companies and organizations create, share, discover, modify, access, comment, discuss and exchange information through the Internet. Social Media Response solution for ConceptDraw PRO provides collection of 10 libraries with diversity of predesigned vector social media flowchart symbols for fast and easy creating interactive Social Media Flowcharts, Response Charts and Action Mind Maps.How To Draw a Diagram
Is it possible to draw a diagram as quickly as the ideas come to you? The innovative ConceptDraw Arrows10 Technology included in ConceptDraw PRO is a simple and powerful tool to create any type of diagram. You mau choose to start from one of plenty diagram templates or to use your own idea.Venn Diagram Examples for Problem Solving. Venn Diagram as a Truth Table
Venn diagrams are illustrations used in the branch of mathematics known as set theory. They show the mathematical or logical relationship between different groups of things (sets). A Venn diagram shows all the possible logical relations between the sets.Venn Diagram Examples for Problem Solving. Computer Science. Chomsky Hierarchy
A Venn diagram, sometimes referred to as a set diagram, is a diagramming style used to show all the possible logical relations between a finite amount of sets. In mathematical terms, a set is a collection of distinct objects gathered together into a group, which can then itself be termed as a single object. Venn diagrams represent these objects on a page as circles or ellipses, and their placement in relation to each other describes the relationships between them. The Venn diagram example below visualizes the the class of language inclusions described by the Chomsky hierarchy.ConceptDraw Arrows10 Technology
Imagine the diagram which is looking smart. That is how ConceptDraw Arrows10 Technology or Smart connectors work. Thanks to auto-routing feature connectors flow around objects. But if you want some background objects that the connectors flow through - that is also possible to do.- Er Diagram For Swimming Pool Management System
- Swimming Pool Management System Usecase Diagram
- Swimlane Diagram Online
- Swim Lane Diagrams | Swim Lane Flowchart Symbols | Sport Field ...
- Total Quality Management Value | Swim Lane Diagrams | UML ...
- Swimlane Diagram For Issuing Po
- Library Management Scenarios Of Cross Functional Flowchart
- Swimlane Diagram Online Free
- Swim Lane Flowchart Symbols | BPMN 2.0 | Communication ...
- Comprehensive System Flow Diagram In Production Management
- Draw Swimlane Diagram Online
- Basic CCTV System Diagram . CCTV Network Diagram Example ...
- Swimlane Diagram For Online Shopping System
- Swim Lane Diagrams | Gym and Spa Area Plans | Sport Field Plans ...
- Process Flowchart | Basic Flowchart Symbols and Meaning | Work ...
- Process Flowchart | Cross-Functional Flowchart | Swim Lane ...
- Er Diagram Of Disaster Management Website
- Chart Organization Of Hotel Management System And Their Function
- UML activity diagram - Snap in process | Azure Management | Active ...
- Www Sub Systems Of A Car Of A Flow Chart


