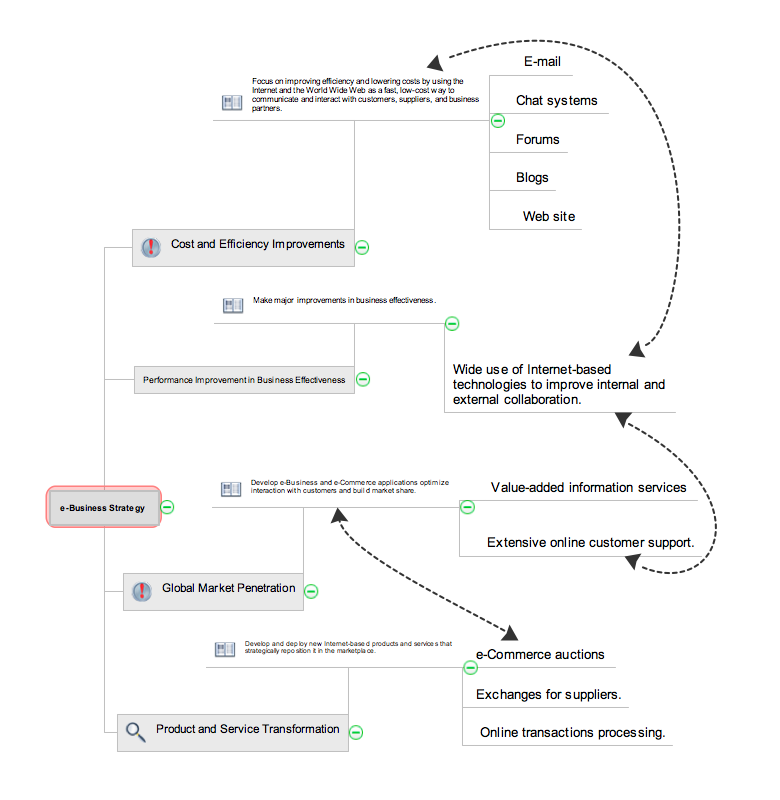
Communication Tool for Remote Project Management

Diagram of a Basic Computer Network. Computer Network Diagram Example

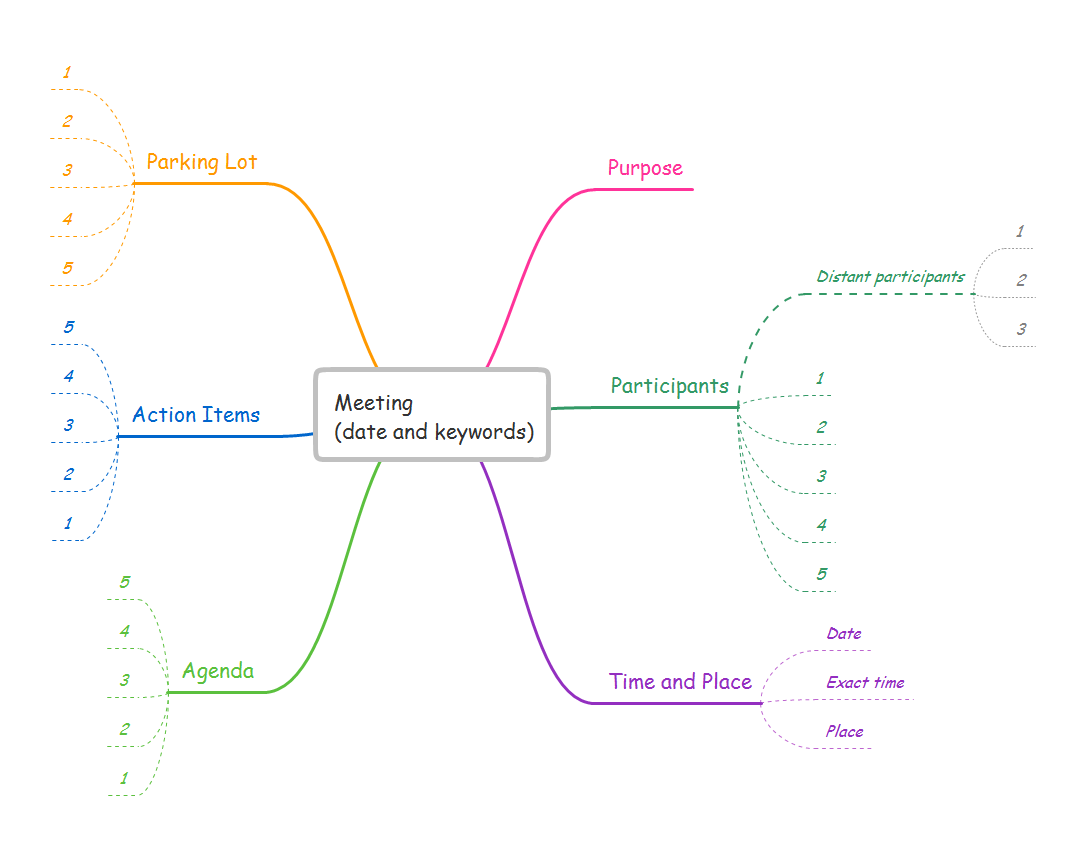
A Tool for EffectiveTeam Meetings

How to show a mind map presentation via Skype
 Entity-Relationship Diagram (ERD)
Entity-Relationship Diagram (ERD) solution extends ConceptDraw DIAGRAM software with templates, samples and libraries of vector stencils from drawing the ER-diagrams by Chen's and crow’s foot notations.
How To Create Good Presentation Ideas
 Education
This solution extends ConceptDraw DIAGRAM and ConceptDraw MINDMAP with specific content that helps illustrate educational documents, presentations, and websites quickly and easily with astronomy, chemistry, math and physics vector pictures and clip art.
Software Diagrams

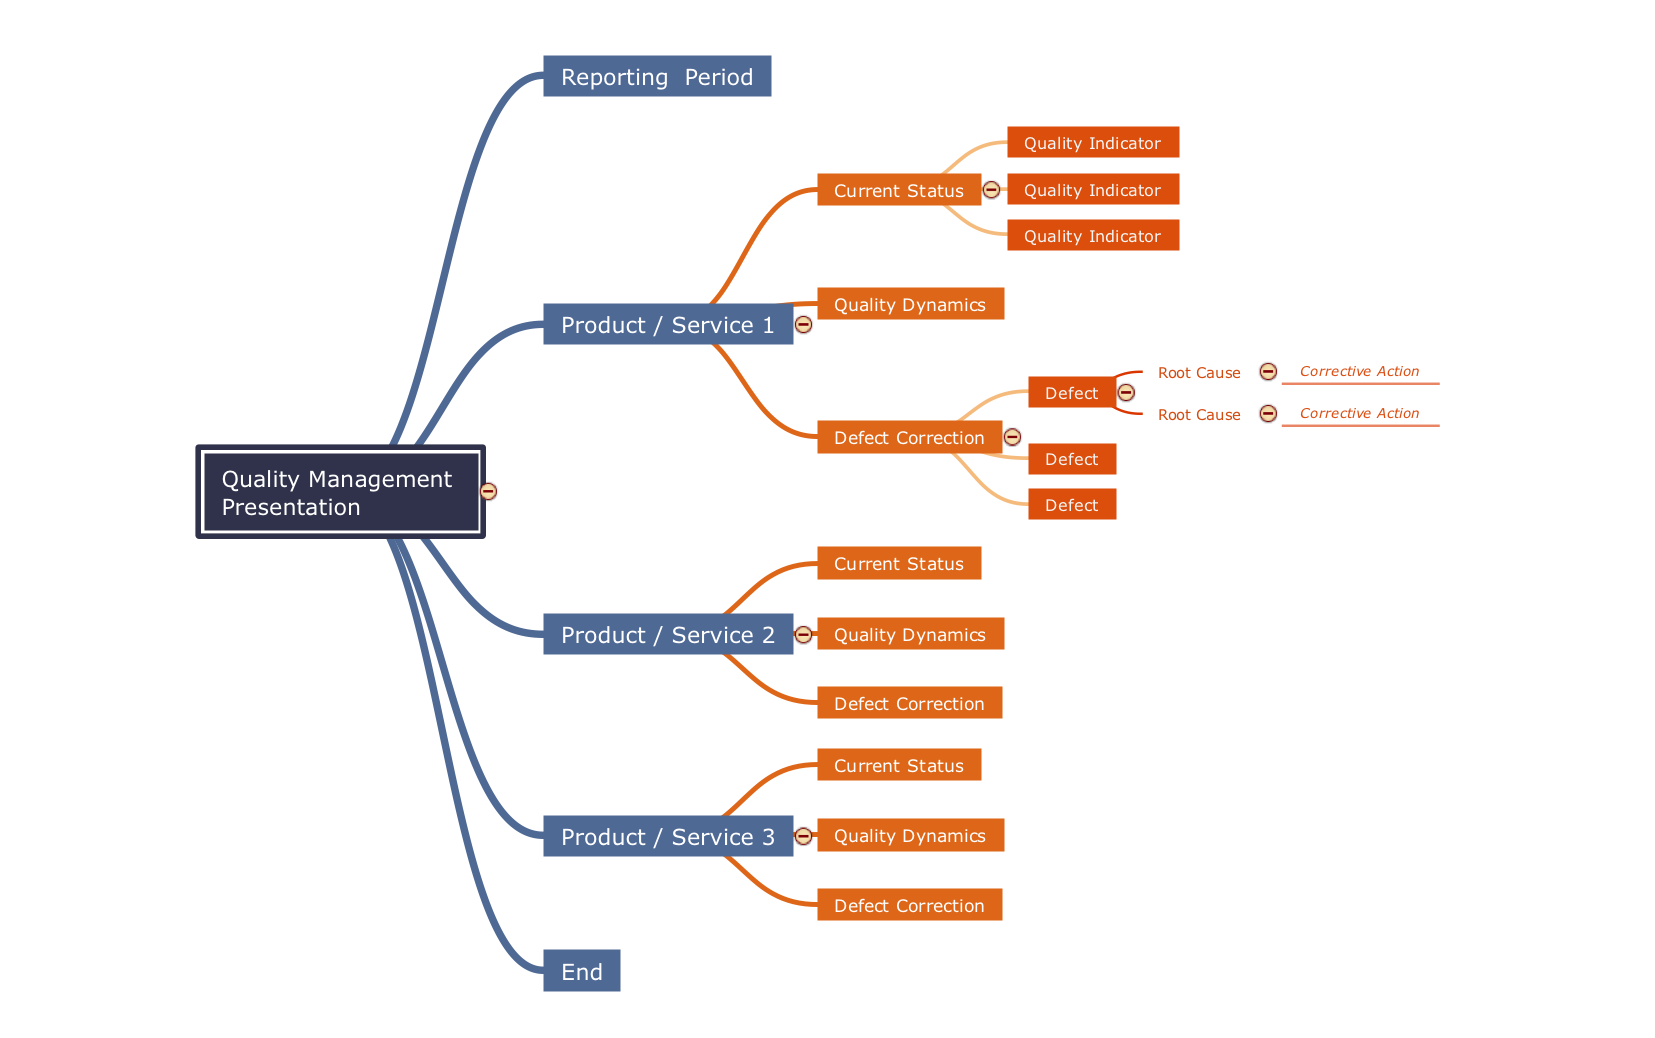
Quality Management Teams
Quality Criteria MindMap
 Illustration
This solution extends ConceptDraw DIAGRAM.4, allowing you to make professional-looking documents, presentations and websites illustrated with color, scalable vector clip art and shapes, regardless of drawing skills.
 Entity-Relationship Diagram (ERD)
An Entity-Relationship Diagram (ERD) is a visual presentation of entities and relationships. That type of diagrams is often used in the semi-structured or unstructured data in databases and information systems. At first glance ERD is similar to a flowch
 Event-driven Process Chain Diagrams
Event-Driven Process Chain Diagrams solution extends ConceptDraw DIAGRAM functionality with event driven process chain templates, samples of EPC engineering and modeling the business processes, and a vector shape library for drawing the EPC diagrams and EPC flowcharts of any complexity. It is one of EPC IT solutions that assist the marketing experts, business specialists, engineers, educators and researchers in resources planning and improving the business processes using the EPC flowchart or EPC diagram. Use the EPC solutions tools to construct the chain of events and functions, to illustrate the structure of a business process control flow, to describe people and tasks for execution the business processes, to identify the inefficient businesses processes and measures required to make them efficient.
Line Chart Examples

- Personal Swot Analysis Examples For Students
- Samples Of Students Swot Analysis
- Personal Swot Analysis Example Student
- Swot Analysis On Yourself Example For University Students
- Example Of Personal Swot Analysis Of A Student
- Examples Of Swot Analysis For Students
- Swot Analysis For Engineering Students Examples
- Swot Analysis Ppt For Students
- Swot Analysis Example Student
- Swot Analysis Of A Student
- Sort Analysis Example For Students
- Examples Threats Of Swot Analysis In Personal Students
- Personal Swot Analysis Examples Templates
- Swot Analysis For Students
- Swot Analysis Student
- Personal Swot Analysis Examples Of Mechanical Engineers
- Small business consultancy SWOT analysis matrix | How to Create ...
- Swot Analysis For Mechanical Engineering Student
- Swot Analysis Of Mechanical Engineering Student
- Small business consultancy SWOT analysis matrix | How to Create ...