Swot Analysis Examples
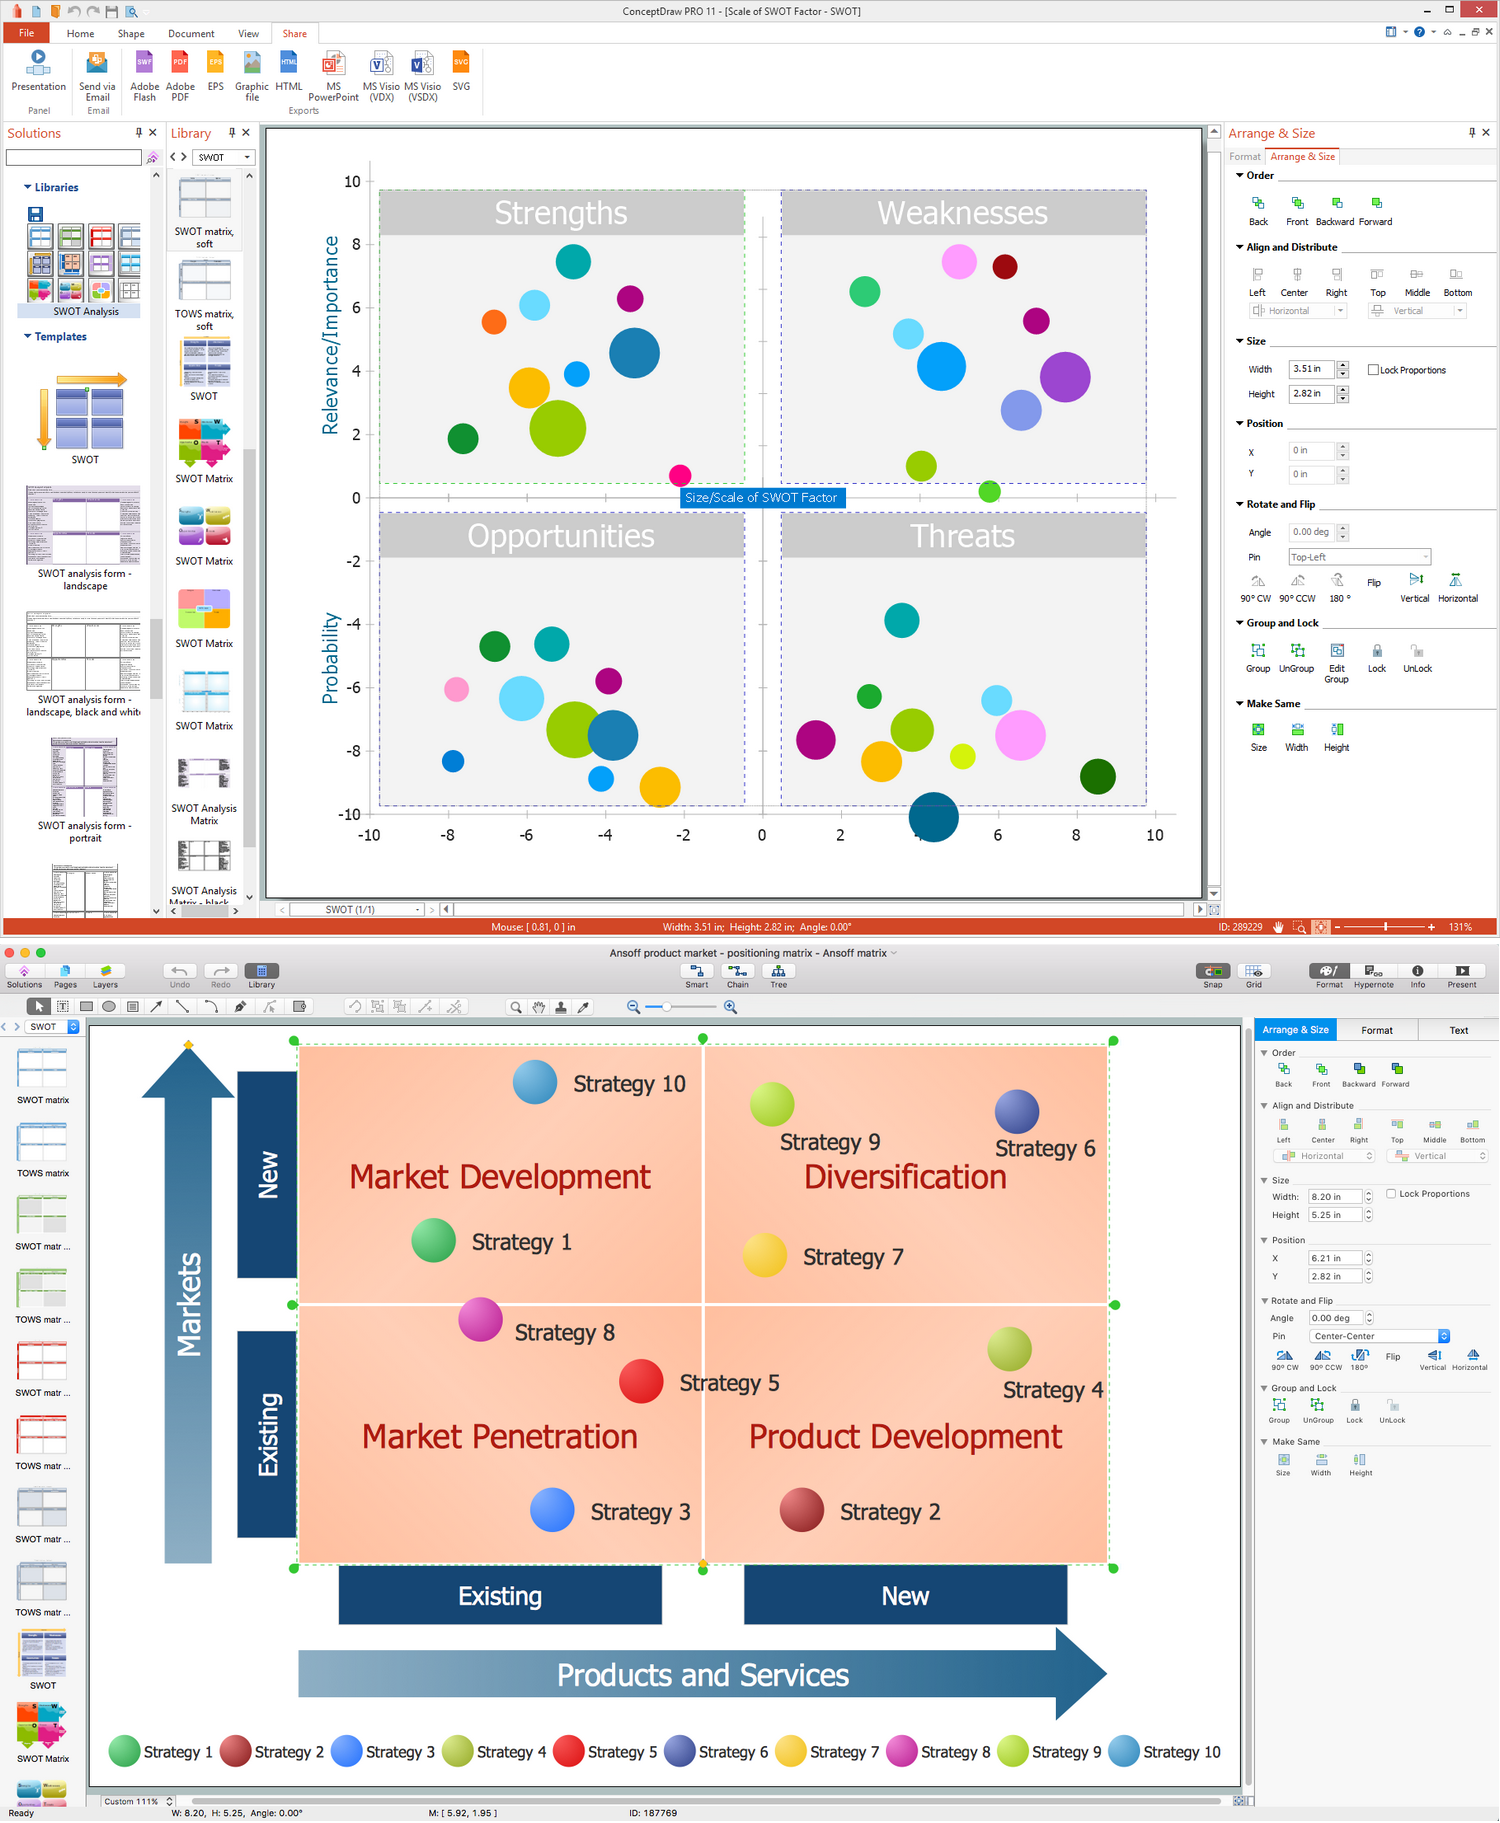
SWOT analysis is an advanced plan making methodology for detection the Strengths and Weaknesses, Opportunities and Threats, that are involved in a project. SWOT analysis possesses a wide variety of real and potential applications and is a key part of any business planning and analysis. SWOT analysis uses as a visual tool the SWOT diagrams and SWOT matrices. ConceptDraw DIAGRAM software with SWOT and TOWS Matrix Diagrams solution provides a lot of SWOT analysis examples and samples, and also numerous collection of built-in SWOT templates, which will be the good start in your self-depending drawing and the perfect source of inspiration. You can always start to design your SWOT diagrams from the blank sheet using the included predesigned vector objects, but in many cases to save the time and efforts for SWOT diagramming would be preferable to use the ready example the most appropriate to your needs. Customizing the proposed SWOT diagrams you will achieve a great success in drawing SWOT matrices of any style and complexity.SWOT analysis Software & Template for Macintosh and Windows
Experienced businessmen and professional marketing specialists know that the success in business largely depends on the chosen company's development strategy. To develop a correct development and promotion strategy for each individual business enterprise is needed a SWOT analysis. It is used to prepare marketing strategies for growing your business in the right direction, helps to develop the strategic alternative in the field of staff management and logistics, assists to know the strengths and weaknesses of the company, and also to identify the factors that affect the industry as a whole and this company in particular. Professional SWOT analysis is often holding by consulting companies. SWOT analysis is that tool which lets you make your business more successful. Realize it easily using professional SWOT analysis software developed for Macintosh and Windows OS - ConceptDraw DIAGRAM. Enhanced with SWOT and TOWS Matrix Diagrams solution, ConceptDraw DIAGRAM offers a lot of predesigned vector stencils for SWOT analysis, quick-start templates, useful SWOT samples and TOWS examples.Gant Chart in Project Management
Gantt Chart is a graphical representation of tasks as segments on a time scale. It helps plan and monitor project development or resource allocation. There are list of tasks, project milesones and stages. The horizontal axis is a time scale, expressed either in absolute or relative time. Gantt chart can be used for planning in virtually any industry. There are major project planning tools using gantt chart for creating project plan. For instance, using ConceptDraw PROJECT together with ConceptDraw MINDMAP for planning marketing actions is very effective way. It makes ConceptDraw Office best marketing project management software for gantt chart planning marketing message, scheduling stages when to send massive text messages or when use email marketing services in specific projects. There are simple steps on how to use project management software for marketing, sales actions and product support. This is simple all in one toolbox for managers who need best project management software for small business as for planning and brainstorming as for reporting at project execution stage. Using gantt charts together with mindmap visuals and professional presentations charts make it excellent creative project management software. ConceptDraw PROJECT is portfolio project management software it allows manage many projects with multi gantt chart.
Software for Creating SWOT Analysis Diagrams
SWOT analysis or alternatively SWOT matrix is a simple, but useful tool for auditing an organization and its environment, for analyzing its strengths and weaknesses, opportunities and threats that can appear. A SWOT analysis can be executed for an industry, product, place, or person. It is a first stage of planning which helps the marketing specialists to focus on the key issues. SWOT analysis includes the identification of objectives of the project or business venture, specification of internal and external factors favorable and vice versa unfavorable for achievement the designated goal. ConceptDraw DIAGRAM ector graphics software enhanced with SWOT and TOWS Matrix Diagrams solution from Management area of ConceptDraw Solution Park is a powerful software for creating SWOT analysis diagrams. Ready-to-use templates, samples and examples allow create your own TOWS and SWOT matrices in minutes. The integration between ConceptDraw MINDMAP and ConceptDraw DIAGRAM applications will be also helpful for easier drawing.How to Collaborate in Business via Skype
Collaboration software for small and medium business allows communicate with partners around the globe via Skype.
Business Tools Perceptual Mapping
This sample shows the Perceptual map. It was created in ConceptDraw DIAGRAM diagramming and vector drawing software using the Matrices Solution from the Marketing area of ConceptDraw Solution Park. Perception Mapping helps organizations measure and transform all aspects of their business, people and culture. Perception Mapping allows to represent the complex relationships graphically, helps identify potential problems of the organization and make the best decisions.SWOT Matrix Software
The SWOT Analysis solution from the Management area of ConceptDraw Solution Park contains set of examples, templates and vector design elements of SWOT and TOWS matrices. It helps you to quickly draw SWOT and TOWS analysis matrix diagrams using the best SWOT matrix software ConceptDraw DIAGRAM.TOWS Matrix
TOWS Matrix is an effective tool which allows to analize the external opportunities and threats by means of analyzing the internal strengths and weaknesses of a company. ConceptDraw DIAGRAM diagramming and vector drawing software extended with SWOT and TOWS Matrix Diagrams Solution from the Management Area will help design TOWS Matrix for your company without efforts.
 Education Package
Education Package is a comprehensive set of multifarious graphical solutions from ConceptDraw Solution Park, collected together in help to ConceptDraw DIAGRAM users working in a field of science, education and training, which is aimed at improving the quality of education and helping to design with ease variety of interesting and colorful educational materials, diagrams, charts and maps. Use it to present the information and knowledge in an interesting, clear, structured and simple form to achieve a success in education and pedagogy, to maintain the interest of students and pupils throughout the whole learning process, at the lectures, lessons and even during independent work with additional materials, to contribute to better perception of scientific information by listeners during the conferences and reports.
- Example Student Software Engineer Personal Swot Analysis
- Swot Analysis Examples For Software Engineer
- Personal Swot Analysis Examples Of Mechanical Engineers
- Example Swot For Engg Student
- Swot Analysis Of System Engineering Company
- Swot Analysis Of Engineer
- Engineering Swot Analysis Example
- SWOT Analysis | Marketing Analysis Diagram | SWOT and TOWS ...
- Swot Analysis Related To Electrical Engineer
- Education Package | Swot Analysis Of Diploma Student


