HelpDesk
How to Create SWOT Analysis Template Using ConceptDraw PRO
SWOT-analysis is used to develop a marketing strategy. SWOT-analysis includes determining the strengths and weaknesses in the company's activity, potential external threats and opportunities and assesses their relative strategic competitors. ConceptDraw SWOT and TOWS Matrix Diagrams solution provide a set of SWOT matrix in which should be recorded and then compared the strengths and weaknesses of the enterprise and the market opportunities and threats. This comparison allows you to determine what steps can be taken for the development of your company and what problems need to be addressed urgently.
 Interactive Voice Response Diagrams
Interactive Voice Response Diagrams solution extends ConceptDraw PRO v10 with samples, templates and library of ready-to-use vector stencils to help create Interactive Voice Response (IVR) diagrams illustrating a work of interactive voice response system, Voice-over-Internet Protocol (VoIP) diagrams and Action VoIP diagrams with representing voice actors on them.
Think. Act. Accomplish.
ConceptDraw MINDMAP is ready to provide you with mind mapping tool which can serve as comprehensive productivity tool for your business.HelpDesk
How to Draw a Line Chart Quickly
A common line chart is a graphical representation of the functional relationship between two series of data. A line chart that is created by connecting a series of data points together with a straight line is the most basic type of a line chart. A line chart can be used for depicting data that changes continuously over time. It is extensively utilized in statistics, marketing and financial business. ConceptDraw Line Graph solution provides the possibility to make 2D line charts quickly and effortlessly.
 Stakeholder Onion Diagrams
The Stakeholder Onion Diagram is often used as a way to view the relationships of stakeholders to a project goal. A basic Onion Diagram contains a rich information. It shows significance of stakeholders that will have has influence to the success achieve
 Fire and Emergency Plans
This solution extends ConceptDraw software with samples, templates and design elements for drawing the Fire and Emergency Plans.
 Target and Circular Diagrams
This solution extends ConceptDraw PRO software with samples, templates and library of design elements for drawing the Target and Circular Diagrams.
HelpDesk
How to Draw a Circular Arrows Diagram Using ConceptDraw PRO
The cyclic recurrence is a fundamental property of multiple systems. The cycle is a process which consists from elements (phases, stages, stages) following each other. Many processes in astronomy, biology, chemistry, physics, mathematics, etc. have a cycle properties. It is also widely used in information technologies and marketing analysis. Graphical representation of cyclic processes can have many forms. It can be a circle, parabola, hyperbola, ellipse and others. A Circular Arrows Diagram is used as one of the statistical charts in the business, mass media and marketing. ConceptDraw PRO provides its users tools for making easy drawing Circular Arrows Diagrams.HelpDesk
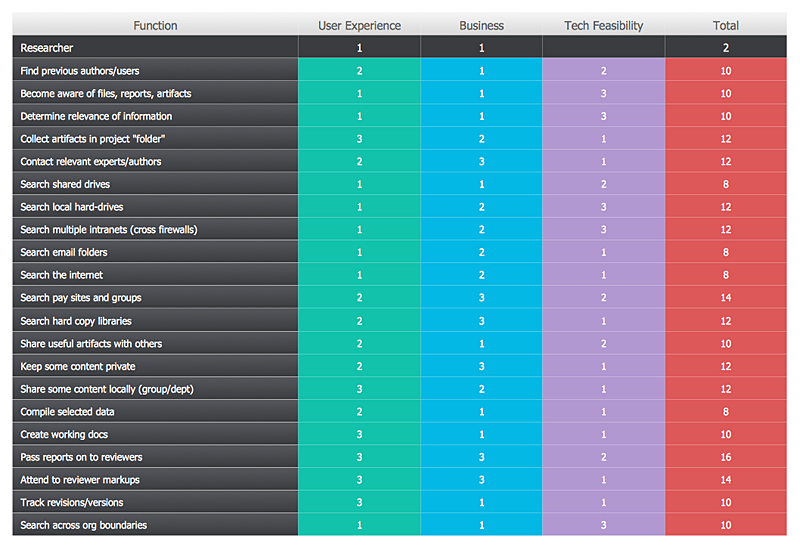
How To Create a Prioritization Matrix
Making the prioritization matrix is helpful when all cannot be done at the same time. Prioritization matrix diagram shows the relationships between factors and this helps , to prioritize tasks and resources. This helps you to narrow down variants. By selecting and weighing options you can quickly determine the best choices and direct team to the best destinations. Prioritization matrix helps to identify a best way of implementing the most priority tasks. It is helpful in a case when you have limited resources. ConceptDraw solution for management and planning compiled from the Seven Management and Planning Tools, provides the ability to quickly build Prioritization Matrix diagrams for your project using special template.HelpDesk
How To Create Root Cause Analysis Diagram Using ConceptDraw Office
Root Cause Analysis diagram is used to analyze the root causes of factors that influence the problem. If the certain factor is the root cause, this mean that its vanishing will help to prevent the further recurrence of the problem. Root Cause diagram helps to identify the root causes for a factor and then propose possible corrective actions. A diagram is constructed separately for each high priority factor. The ability to create a RCA tree diagram from a mind map is supported by the ConceptDraw Seven Management and Planning Tools solution.HelpDesk
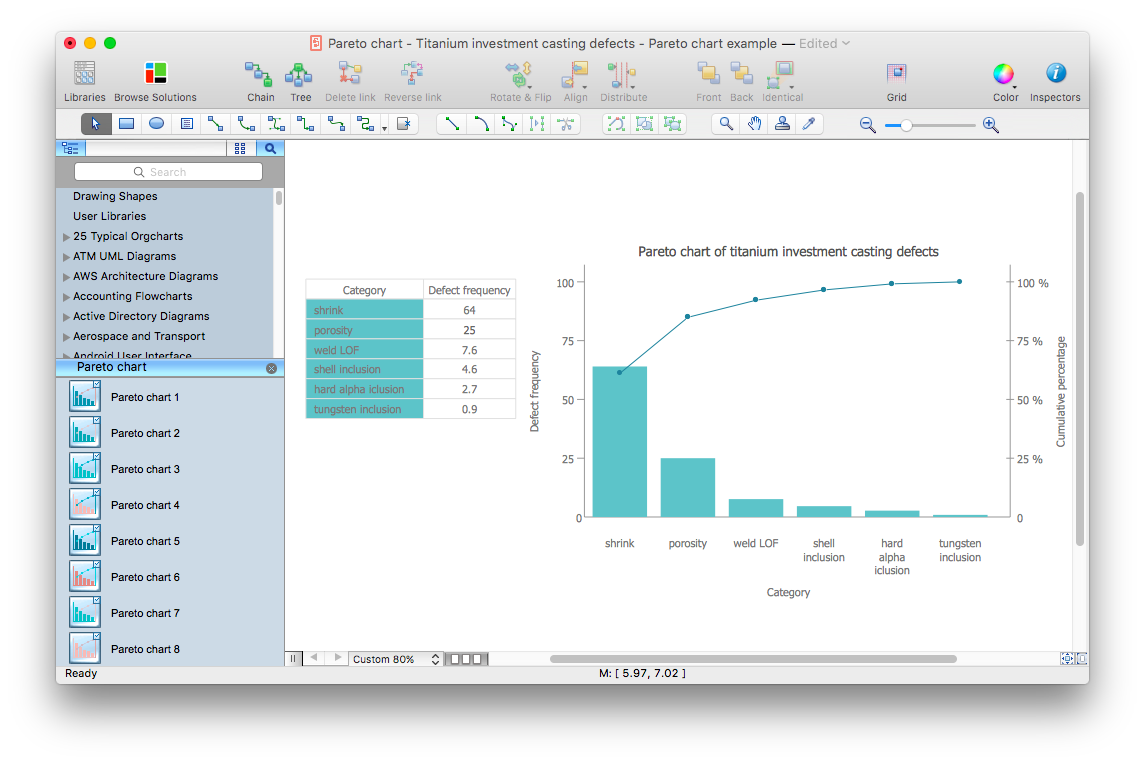
How to Draw a Pareto Chart Using ConceptDraw PRO
The Seven Basic Tools of Quality were picked as effective visual tool-set for identifying the root cause of quality-related problems within the workplace. Seven Basic Tools of Quality comprise of seven diagram that are diverse enough to be used to any business troubleshooting scenario, but simple enough that employees of all types can understand and apply them. One of these tools is a Pareto chart. It combines both a line graph and a bar chart, where the bar chart displays data values, and a line represents a total value. Pareto chart is used for quality control to identify the source of the quality problem.ConceptDraw Seven Basic Tools of Quality solution delivers a big set of vector stencil libraries and samples for each quality control diagram, including a Pareto chart.
HelpDesk
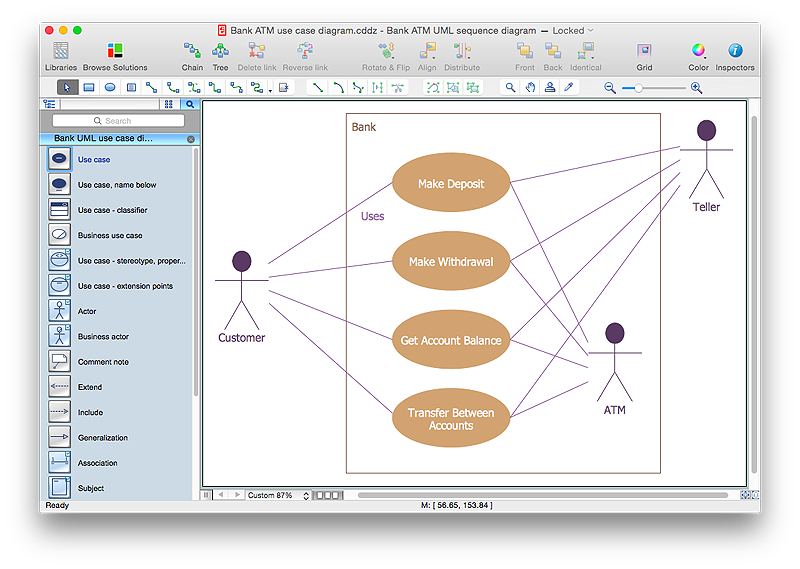
How to Create a Bank ATM Use Case Diagram Using ConceptDraw PRO
UML diagrams are often used in banking management for documenting a banking system. In particular, the interaction of bank customers with an automated teller machine (ATM) can be represented in a Use Case diagram. Before the software code for an ATM, or any other system design, is written, it is necessary to create a visual representation of any object-oriented processes. This is done most effectively by creating a Unified Modeling Language (UML) diagram, using object-oriented modeling. UML works as a general purpose modeling language for software engineers or system analysts, offering a number of different diagram styles with which to visually depict all aspects of a software system.ConceptDraw PRO diagramming software, enhanced and expanded with the ATM UML Diagrams solution, offers the full range of icons, templates and design elements needed to faithfully represent ATM and banking information system architecture using UML standards. The ATM UML Diagrams solution is useful for beginner and advanced users alike. More experienced users will appreciate a full range of vector stencil libraries and ConceptDraw PRO's powerful software, that allows you to create your ATM UML diagram in a matter of moments.
 Social Media Response
This solution extends ConceptDraw PRO and ConceptDraw MINDMAP with the ability to draw interactive flow charts with action mind map templates, to help create an effective response to applicable social media mentions.
HelpDesk
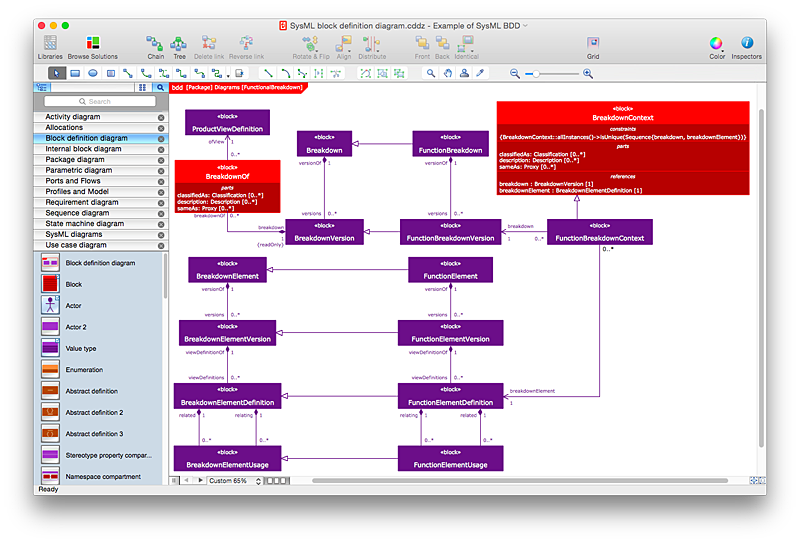
How to Create a SysML Diagram Using ConceptDraw PRO
Systems Modeling Language (SysML) is designed to use for system engineering. It is similar to UML, but much easier to learn. used by to system engineers what UML is to software engineers. Smaller in content and simpler to learn than UML. SysML is focused on standardizing the language used to describe engineering systems. SysML covers a broader range of systems, than can involve personnel, facilities, hardware or electrical components. SysML depicts system using the SysML diagrams. Making a SysML diagram involves many elements that can be managed using SysML solution for ConceptDraw PRO.- New business opportunity SWOT analysis matrix - Template ...
- Emergency Action Plan Template | The Action Plan | Cause and ...
- SWOT Template | SWOT Analysis | SWOT and TOWS Matrix ...
- SWOT Analysis | SWOT Analysis | Small business consultancy ...
- Gantt Chart Templates | Business Processes | Examples of ...
- Swot Analysis Of Finance Department
- Gantt Chart Templates | Business Processes | Gantt Chart Software ...
- How to Create SWOT Analysis Template Using ConceptDraw PRO ...
- Gantt Chart Templates | Business Processes | How to Draw a Gantt ...
- SWOT analysis for a small independent bookstore | Small business ...
- How to Make SWOT Analysis in a Word Document | How to Make ...
- How To Create an Involvement Matrix | Matrix Organization Structure ...
- PROBLEM ANALYSIS . Prioritization Matrix | The Action Plan ...
- Small business consultancy SWOT analysis matrix | How to Create ...
- Table Seating Chart Template | Fire Evacuation Plan Template | The ...
- New business opportunity SWOT analysis matrix - Template ...
- How to Make SWOT Analysis in a Word Document | SWOT Matrix ...
- SWOT Matrix Template | SWOT Analysis | How to Make SWOT ...
- PROBLEM ANALYSIS . Prioritization Matrix | CORRECTIVE ...
- Business Tools Perceptual Mapping | Decision Making | The Action ...


