SWOT Template
The SWOT and TOWS Matrix Diagrams solution from the ConceptDraw Solution Park gives a simple visual support for all steps of a SWOT analysis process, which is a popular strategic planning method used to evaluate the Strengths, Weaknesses, as well as Opportunities and Threats facing a project. Strengths are the project's characteristics giving it the advantages over the others, weaknesses are the characteristics placing the team at the disadvantage relatively to others, opportunities are the elements that the project can exploit to its advantage and threats are the elements that can cause the troubles. The results of a correctly performed SWOT analysis help to achieve effectively the main objective. The SWOT templates included to SWOT and TOWS Matrix Diagrams solution for ConceptDraw DIAGRAM isually support the identifying of internal and external factors that are favorable or unfavorable. Making the SWOT analysis and completing the SWOT Matrix by simple filling a SWOT template, you can then export it to large variety of available formats: PowerPoint presentation, PDF, image files, and others.
 SWOT Analysis
SWOT and TOWS Matrix Diagrams solution extends ConceptDraw DIAGRAM and ConceptDraw MINDMAP software with features, templates, samples and libraries of vector stencils for drawing SWOT and TOWS analysis matrices and mind maps.
Relative Value Chart Software
Relative value is a value measured in the terms of liquidity, risks, return of one investment or financial instrument relative to another. Relative values are widely used in:business, economics, investment, management, marketing, statistics, etc. ConceptDraw DIAGRAM software is the best for drawing professional looking Relative Value Charts. ConceptDraw DIAGRAM provides Divided Bar Diagrams solution from the Graphs and Charts Area of ConceptDraw Solution Park.
 SWOT and TOWS Matrix Diagrams
SWOT and TOWS Matrix Diagrams solution extends ConceptDraw DIAGRAM and ConceptDraw MINDMAP software with features, templates, samples and libraries of vector stencils for drawing SWOT and TOWS analysis matrices and mind maps.
Venn Diagram
Venn diagrams are illustrations used in the branch of mathematics known as set theory. They show the mathematical or logical relationship between different groups of things (sets). A Venn diagram shows all the possible logical relations between the sets.Ansoff Matrix
ConceptDraw DIAGRAM software extended with Matrices Solution from the Marketing Area of ConceptDraw Solution Park offers you the possibility to develop the Ansoff Matrix of any complexity.HelpDesk
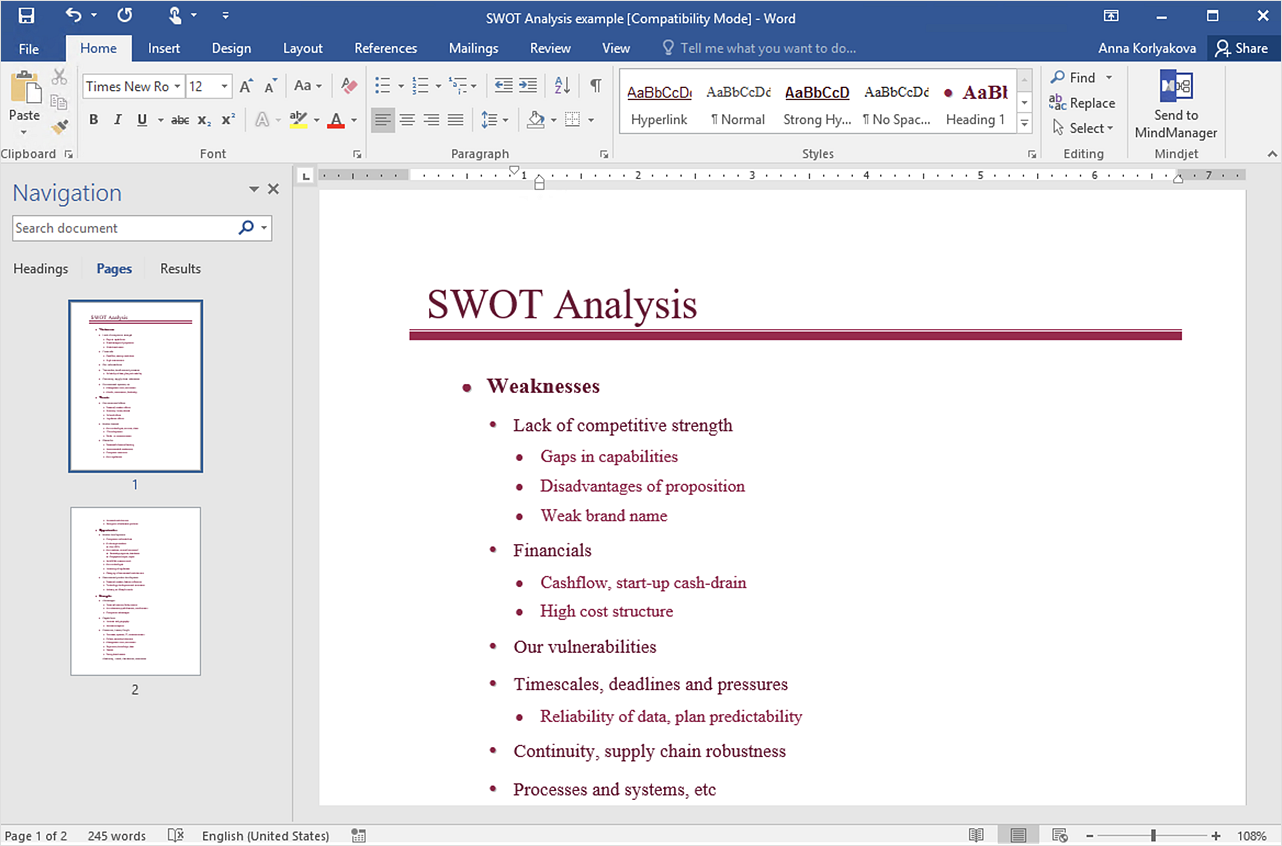
How to Make SWOT Analysis in a Word Document
A SWOT analysis is a strategic planning tool that helps to identify and compare strengths and weaknesses with opportunities and threats to make a decision and create an action plan. When performing a SWOT analysis, one can create a table split up into four columns so as to list each impacting element side-by-side for comparison, but typically it is conducted using a four-square SWOT analysis template. Using mind map allows you to collect and structure a piece of information involved in SWOT Analysis then, you can export your SWOT mind map into an MS Word document that allows you to present and collaborate your business strategic SWOT analysis matrix in MS Word document.Prioritization Matrix
You can design the Prioritization Matrix by hand on the paper, but we offer you the most easier way - to use the ConceptDraw DIAGRAM diagramming and vector drawing software extended with Seven Management and Planning Tools Solution from the Management Area.Create a Presentation Using a Design Template
The intuitive interface of ConceptDraw MINDMAP and the Functional Tools overview below will guide you in creating and demonstrating powerful mind map presentations using template. An advanced tool allows you effectively generate, change, and update your presentation.HelpDesk
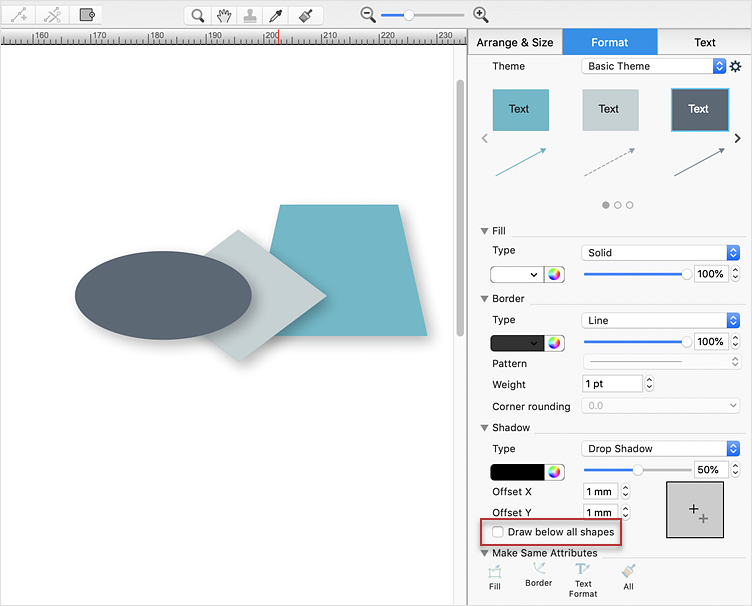
How to Edit Drawing Using Shadow
Tips on how to apply shadow to objects in the ConcepDraw drawingOrganization Chart
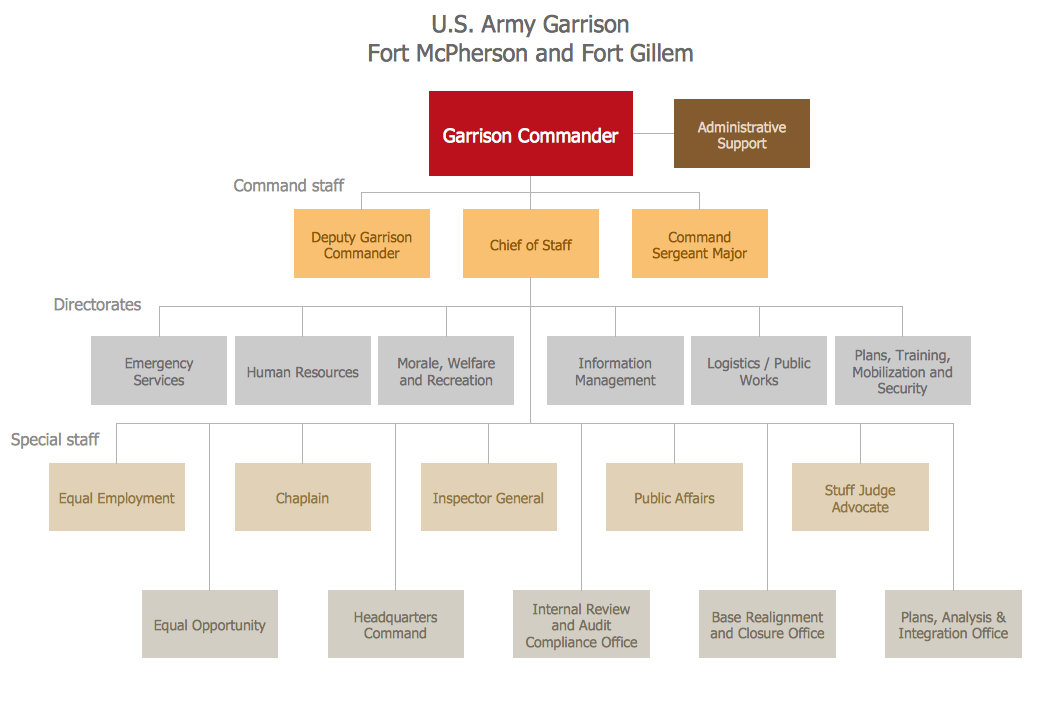
ConceptDraw DIAGRAM diagramming and vector drawing software extended with 25 Typical Orgcharts solution from the Management area of ConceptDraw Solution Park offers 25 ready Organization Chart templates, 10 samples and 2 libraries with predesigned vector objects.Matrix Organization Structure
Matrix organizational structure is one of the main forms of structures which is actively used by organizations to carry forth the functions of a company visually and effectively. Now we have ConceptDraw DIAGRAM diagramming and vector drawing software extended with 25 Typical Orgcharts solution from the Management area of ConceptDraw Solution Park which will help easy represent matrix organizational structure of any degree of complexity.ConceptDraw DIAGRAM
ConceptDraw DIAGRAM is a powerful business and technical diagramming software tool that enables you to design professional-looking graphics, diagrams, flowcharts, floor plans and much more in just minutes. Maintain business processes performance with clear visual documentation. Effectively present and communicate information in a clear and concise manner with ConceptDraw DIAGRAM.HelpDesk
How to Create a Business Process Workflow Diagram
Any business process consists from a set of activities and tasks intended to accomplish a particular business objective. Making a business process workflow diagram is a visual way for business process analysis. Business process workflow diagram should show how various process participants interact with each other to accomplish business tasks and how the corresponding information flows through the business process stages. A business process workflow diagram can be in help when there is a need to improve the business process. It provides the clear vision on what steps, decisions or activities involved in a process need to be improved. The simplicity of business process workflow diagrams makes them useful tools for process communicating, documenting and guidance on how to do a particular work. ConceptDraw DIAGRAM , with the extended functionality of the Business Process Workflow Diagrams solution, is the ideal medium for creating designs of this type. Business Process The Workflow Diagrams solution contains the set of libraries that help to represent various steps and kinds of business processes.Bubble diagrams with ConceptDraw DIAGRAM
Using ConceptDraw you will be able to create bubble diagrams from the ready ConceptDraw library objects or make your own objects. The created diagram can be saved and edited, objects can be moved and links between them will be automatically repainted after object moving because of using the ConceptDraw connectors.- SWOT Analysis Solution - Strategy Tools | Design elements - SWOT ...
- SWOT Analysis Solution - Strategy Tools | SWOT Sample in ...
- SWOT Sample in Computers | Local area network (LAN). Computer ...
- SWOT analysis matrix diagram templates | Purchasing Flow Chart ...
- Competitive strategy matrix - Template | Competitive strategy matrix ...
- SWOT Analysis | Mind Maps for Business - SWOT Analysis | Small ...
- Data Flow Diagram Symbols. DFD Library | Coad/Yourdon's Object ...
- Comparison Dashboard | Feature Comparison Chart Software ...
- SWOT analysis matrix diagram templates | SWOT Analysis | Ansoff's ...
- Feature Comparison Chart Software | Marketing | Bar Chart ...
- Bar Chart Template for Word | SWOT analysis matrix diagram ...
- SWOT Matrix Template | UML Activity Diagram | Basic Workflow ...
- Process Flowchart | Swot Analysis Examples | Flowchart Marketing ...
- SWOT Sample in Computers | Gane Sarson Diagram | Diagramming ...
- Swot Analysis Examples Strengths
- SWOT Matrix Template
- Flowchart Example : Flow Chart of Marketing Analysis | SWOT ...
- Feature Comparison Chart Software | SWOT analysis matrix ...
- Financial Comparison Chart | Feature Comparison Chart Software ...


