Basic Flowchart Symbols and Meaning


HelpDesk
How to Create a House of Quality Diagram

Seven Basic Tools of Quality — Quality Control

Management Tools — Total Quality Management

TQM Diagram Tool

Value-Stream Mapping for Manufacturing
")
Value Stream Mapping Symbols

Identifying Quality Management System

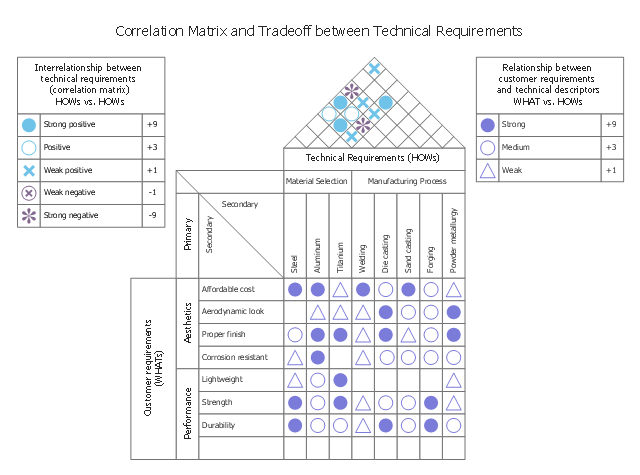
This house of quality sample illustrates correlation matrix.
It was designed on the base of the figure 3-5 in Lecture "How QFD helps in product quality improvement?" from the website of National Programme on Technology Enhanced Learning (NPTEL), India. [nptel.ac.in/ courses/ 110101010/ downloads/ mod3/ Module%20 III-Lec1.pdf]
Distributed under Creative Commons Attribution-ShareAlike 4.0 International (CC BY-SA 4.0) [creativecommons.org/ licenses/ by-sa/ 4.0/ ]
"After drafting the relationship matrix, it is evaluated for any empty row or column. An empty row indicates that a customer voice is not being addressed by any technical descriptors. Thus, the customer expectation is not being met. Any blank column indicates that the technical requirement is unnecessary, as it does not address any VOC.
The roof of the house of quality, expressed as correlation matrix, is used to identify any interrelationships between the technical descriptors (Figure 3-5). Symbols are used to describe the strength of the interrelationships. Symbols generally preferred are:
- A ‘solid circle’ represents a strong positive relationship.
- A ‘circle’ represents a positive relationship.
- An ‘X’ represents a negative relationship.
- An ‘asterisk’ represents a strong negative relationship." [nptel.ac.in/ courses/ 110101010/ modules/ module3/ lec1/ 1.7.html]
The HOQ example "House of Quality - correlation matrix" was designed using ConceptDraw PRO software extended with House of Quality solution from Quality area of ConceptDraw PRO Solution Park.
HOQ of a handlebar stem in a bicycle
Network Hubs


- Mechanical Drawing Symbols | Symbal Use In Quality
- Quality Control Instrument And All Drawing Symbol
- Basic Symbol Of Quality Control In Mechanical
- Process Flowchart | Machining Symbol In Quality Control
- Design elements - TQM diagram | Drawing Symbol In Quality ...
- Quality Engineer Drawing Symbol
- Symbols In Quality Control
- Mechanical Engineering | Quality Symbol Mechanical Engineer
- Symbols Used In Quality Control Department
- All Type Of Symbol Used In Quality Inspection