Symboles Organigramme
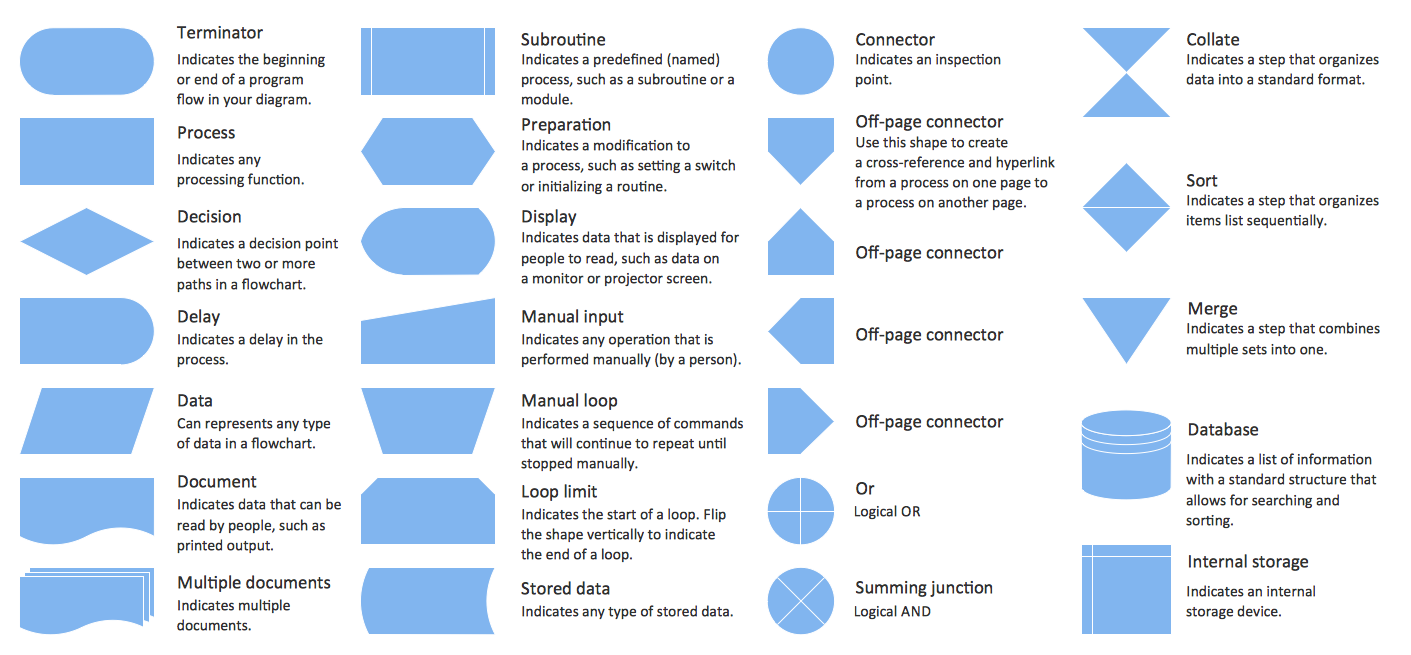
Les organigrammes sont parfaits pour représenter visuellement des processus operationnels. Par exemple, si vous avez besoin d'afficher le flux d'un processus d'ordre personnalisé par l'entremise de divers opérateurs au sein de votre organisation, vous pouvez utiliser un organigramme. Voir aussi d'autres symboles organigramme: Symboles ordinogramme standard, symboles du flux de travail, Vérification Les symboles du schéma fonctionnel, sOrganigramme comptables des symboles, Organigramme de vente des symboles, Symboles pour organigramme des RH, Carte des symboles de processus, Diagramme de processus opérationnels, Symboles utilisés dans le schéma IDEF0.Conception d'organigramme Organigramme des symboles, formes, stencils et icônes
Mavericks a toujours voulu se démarquer, notamment grâce à des choix de design épurés. Les présentations et documents graphiques professionnels sont plus compréhensibles et clairs s'ils utilisent des thématiques de couleurs distinctes pour leurs différentes composantes. La présentation par organigramme rend les démonstrations et les explications de processus opérationnels plus flexibles, et offre un aperçu d'un nouveau genre, se démarquant des organigrammes noir et blanc classiques sur papier. Les meilleures présentations peuvent être obtenues en utilisant les modèles « Conceptdraw » adéquats comme base de départ. Choisissez simplement l'un d'eux et entrez le texte souhaité dans chaque forme du diagramme. Appliquez moins de couleurs dans le document afin de ne pas le transformer en arc-en-ciel, trois ou quatre sera suffiront, notez également que la modélisation des processus opérationnels ne doivent pas contenir des nuances trop claires. Il est aussiProcess Flow Diagram Symbols
Chemical and Process Engineering Solution from the Industrial Engineering Area of ConceptDraw Solution Park is a unique tool which contains variety of predesigned process flow diagram symbols for easy creating various Chemical and Process Flow Diagrams in ConceptDraw DIAGRAM.Basic Flowchart Symbols and Meaning
Flowcharts are the best for visually representation the business processes and the flow of a custom-order process through various departments within an organization. ConceptDraw DIAGRAM diagramming and vector drawing software extended with Flowcharts solution offers the full set of predesigned basic flowchart symbols which are gathered at two libraries: Flowchart and Flowcharts Rapid Draw. Among them are: process, terminator, decision, data, document, display, manual loop, and many other specific symbols. The meaning for each symbol offered by ConceptDraw gives the presentation about their proposed use in professional Flowcharts for business and technical processes, software algorithms, well-developed structures of web sites, Workflow diagrams, Process flow diagram and correlation in developing on-line instructional projects or business process system. Use of ready flow chart symbols in diagrams is incredibly useful - you need simply drag desired from the libraries to your document and arrange them in required order. There are a few serious alternatives to Visio for Mac, one of them is ConceptDraw DIAGRAM. It is one of the main contender with the most similar features and capabilities.
Audit Flowchart Symbols
The audit is a complex process consisting of defined quantity of steps, which have as a final goal the ensuring of success of a certain business project. It includes the independent examination of data, statements and financial performances of an enterprise for a stated purpose. It is convenient to construct the Audit Flowcharts or Audit Diagrams for visual representation and structuring the audit processes. ConceptDraw DIAGRAM diagramming software enhanced with Audit Flowcharts solution from the Finance and Accounting area of ConceptDraw Solution Park effectively helps to draw the Audit Diagrams for accounting, finance and money management, the Audit Flowcharts for fiscal information tracking, financial inventories and documenting Six Sigma, the decision making Flow Charts, etc. This solution provides the powerful drawing tools, numerous templates and samples, and large quantity of vector audit flowchart symbols that greatly facilitate the process of representation the audit steps and audit results, and designing efficient and visually appealing Audit Flowcharts.Electrical Symbols — Qualifying
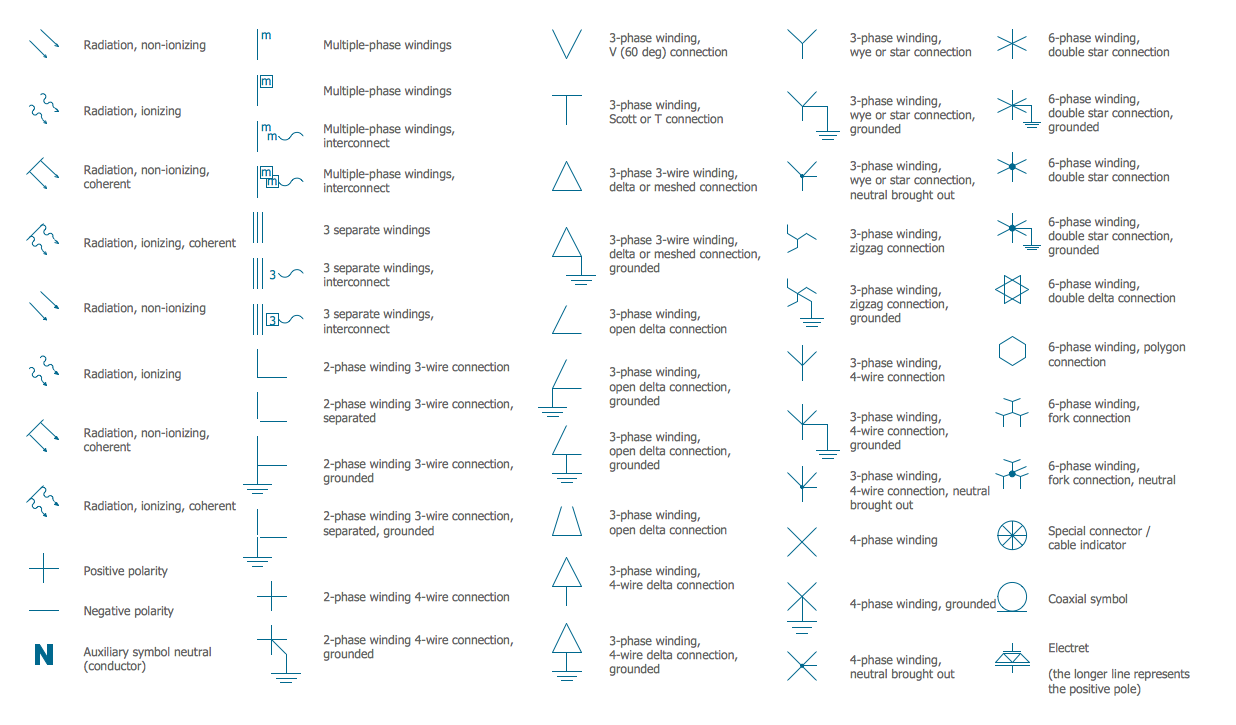
A qualifying symbol is graphics or text added to the basic outline of a device’s logic symbol to describe the physical or logical characteristics of the device. 26 libraries of the Electrical Engineering Solution of ConceptDraw DIAGRAM make your electrical diagramming simple, efficient, and effective. You can simply and quickly drop the ready-to-use objects from libraries into your document to create the electrical diagram.CORRECTIVE ACTIONS PLANNING. PERT Chart
The PERT Chart is constructed as part of the process in creating a schedule of corrective actions. The PERT Chart shows the logical connections and consequence of tasks to be performed. It displays the time period for problem solving and the implementation of all activities through the critical path. ConceptDraw Office suite is a software for corrective actions planning.
BPMN
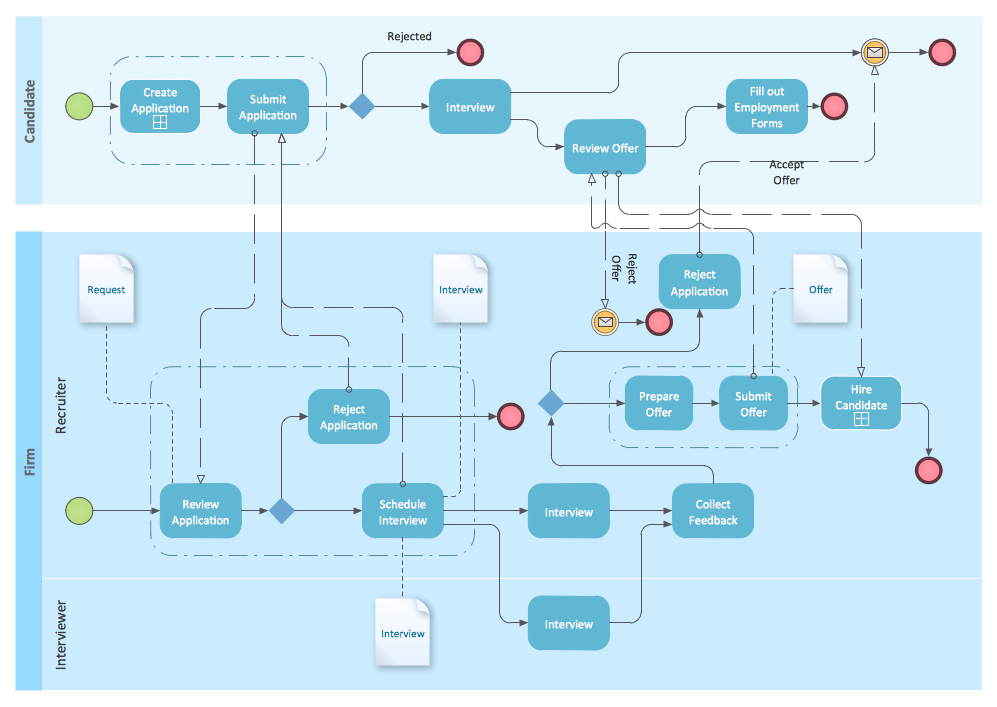
You need to draw professional looking BPMN diagrams quick and easy? Pay please your attention on ConceptDraw DIAGRAM diagramming and vector drawing software. Extended with Business Process Diagram Solution from the Business Processes Area it will be ideal for your.IDEF1 standard
Use Case Diagrams technology. Using visual graphical objects IDEF1 standard allows to model information interrelations.UML Sequence Diagram Example. SVG Vectored UML Diagrams Tools
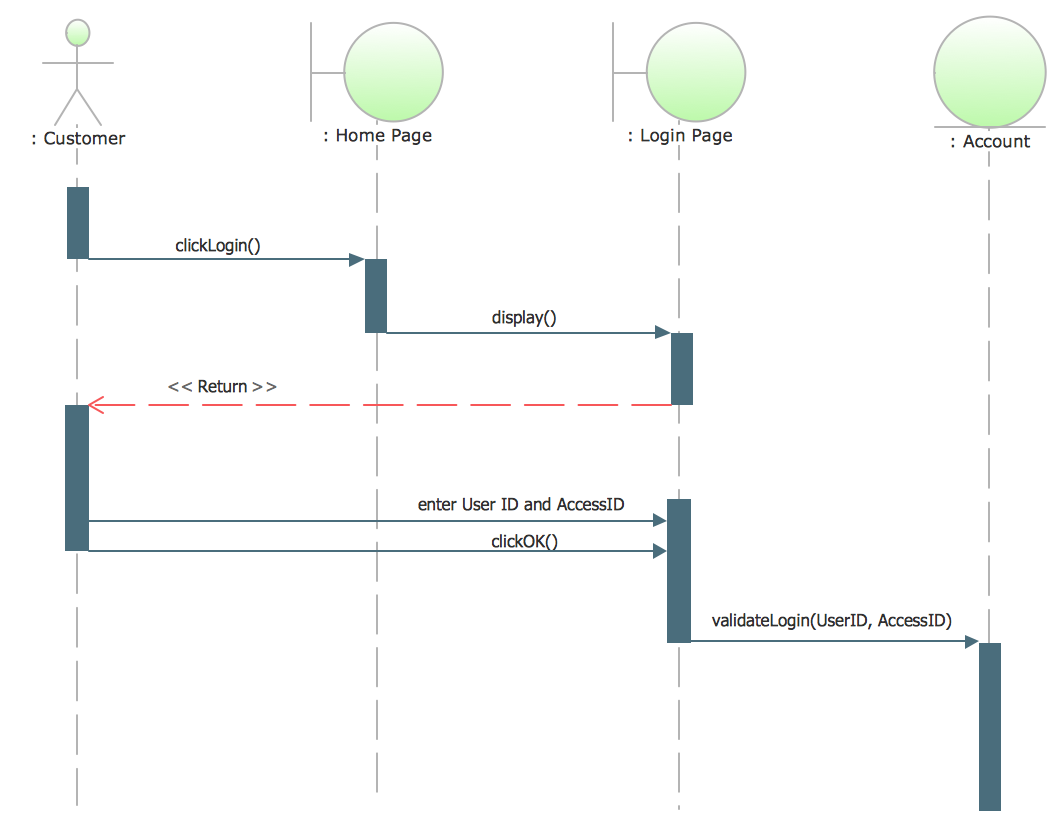
This sample was created in ConceptDraw DIAGRAM diagramming and vector drawing software using the UML Sequence Diagram library of the Rapid UML Solution from the Software Development area of ConceptDraw Solution Park. This sample shows the interactions of the customer with the system and is used at the registration on the sites.- Chen Notation | Design elements - ER diagram (Chen notation ...
- Swim Lane Diagrams | Swim Lane Flowchart Symbols | Cross ...
- Symboles Organigramme | Diagramme De Circulation Flow Chart
- Data Flow Diagram Symbols . DFD Library
- Process Flowchart | Symboles Organigramme | Taxi Call Center ...
- Electrical Symbols — Switches and Relays | Electrical Symbols ...
- Symbole Diagramme De Circulation Des Documents
- Symboles Organigramme | Conception d'organigramme ...
- Cross-Functional Flowchart | Symboles Organigramme | Component ...
- Organizational Structure Diagram Software | Organizational ...


