VSM symbols are the best for a production process designing. The entire Value Stream Mapping method uses a graphical representation of the manufacturing process, factors' pros and cons, that all stakeholders can easily understand. Value Stream Mapping is a graphical technique that provides possibilities to improve analysis of a manufacturing process, at the stage of the transferring information or materials that required to deliver a product or service to the customer.
Flowcharts are the best for visually representation the business processes and the flow of a custom-order process through various departments within an organization. ConceptDraw DIAGRAM diagramming and vector drawing software extended with Flowcharts solution offers the full set of predesigned basic flowchart symbols which are gathered at two libraries: Flowchart and Flowcharts Rapid Draw. Among them are: process, terminator, decision, data, document, display, manual loop, and many other specific symbols.
The meaning for each symbol offered by ConceptDraw gives the presentation about their proposed use in professional Flowcharts for business and technical processes, software algorithms, well-developed structures of web sites, Workflow diagrams, Process flow diagram and correlation in developing on-line instructional projects or business process system. Use of ready flow chart symbols in diagrams is incredibly useful - you need simply drag desired from the libraries to your document and arrange them in required order.
There are a few serious alternatives to Visio for Mac, one of them is ConceptDraw DIAGRAM. It is one of the main contender with the most similar features and capabilities.
The main reason of using Process Flowchart or PFD is to show relations between major parts of the system. Process Flowcharts are used in process engineering and chemical industry where there is a requirement of depicting relationships between major components only and not include minor parts. Process Flowcharts for single unit or multiple units differ in their structure and implementation.
ConceptDraw DIAGRAM is Professional business process mapping software for making Process flowcharts, Process flow diagram, Workflow diagram, flowcharts and technical illustrations for business documents and also comprehensive visio for mac application. Easier define and document basic work and data flows, financial, production and quality management processes to increase efficiency of your business with ConcepDraw DIAGRAM. Business process mapping software with Flowchart Maker ConceptDraw DIAGRAM includes extensive drawing tools, rich examples and templates, process flowchart symbols and shape libraries, smart connectors that allow you create the flowcharts of complex processes, process flow diagrams, procedures and information exchange. Process Flowchart Solution is project management workflow tools which is part ConceptDraw Project marketing project management software.
Drawing charts, diagrams, and network layouts has long been the monopoly of Microsoft Visio, making Mac users to struggle when needing such visio alternative like visio for mac, it requires only to view features, make a minor edit to, or print a diagram or chart. Thankfully to MS Visio alternative like ConceptDraw DIAGRAM software, this is cross-platform charting and business process management tool, now visio alternative for making sort of visio diagram is not a problem anymore however many people still name it business process visio tools.
How To Create a Process Flow Chart (business process modelling techniques)
Use the set of special professionally developed swim lane flowchart symbols - single, multiple, vertical and horizontal lanes from the Swimlanes and Swimlanes BPMN 1.2 libraries from the Business Process Diagram solution, the Swim Lanes library from the Business Process Mapping solution as the perfect basis for your Swim Lane Flowcharts of processes, algorithms and procedures.
The semantic modeling method nowadays is successfully applied in database structure design. It is effective method of modeling the data structures, which is based on the meaning of these data. As a tool of semantic modeling, there are used different types of Entity-Relationship Diagrams. Entity Relationship Diagram (ERD) is applied to visually and clearly represent a structure of a business database. The main components of ERDs are: entity, relation and attributes. An entity is a class of similar objects in the model, each entity is depicted in the form of rectangle and has the name expressed by a noun. Relation is shown in the form of non-directional line that connects two entities. There are several notation styles used for ERDs: information engineering style, Chen style, Bachman style, Martin Style.
The Entity Relationship Diagram symbols used for professional ERD drawing are predesigned by professionals and collected in the libraries of the Entity-Relationship Diagram (ERD) solution for ConceptDraw DIAGRAM software.
A flowchart is a type of diagram which represents an algorithm, process or workflow, displays the steps as boxes of various kinds and depicts their order by connecting them with arrows. Any business graphic document will be more colorful and understandable if will use professional-looking and visual diagrams and flowcharts. Flowchart design gives versatile presenting and explaining of the process.
ConceptDraw DIAGRAM flowchart software enhanced with Flowcharts solution helps effectively make Flowchart Design. Use of predesigned flowchart symbols and bright color palette offers a fresh view and favorably distinguishes the flowcharts designed in ConceptDraw DIAGRAM from the black and white flowcharts on a paper. Preferably to use no more than three or four colors and apply identical for the same shape types. The best flowchart design can be achieved by starting with Flowchart template, or any of suitable ready examples or samples offered in ConceptDraw STORE, open one of them and enter the proper text into each Flowchart shape.
Each symbol of the flowchart has a definition that can't be changed. This means that all flowcharts shapes can be grouped in according to their meaning. Users with ConceptDraw DIAGRAM flowchart software can style groups of symbols with close definitions by color sets chosen from complementary palette.
Almost all workflows can be depicted as a flowchart. Colored diagrams are more light for perception of the certain information, this is part of flowchart design. Bright colors need to be used in the key points of Decision symbols, to focus attention on their importance for whole process flow.
Business Process Modeling with ConceptDraw "Business Process Diagrams" Solution
Business process modeling is known in the corporate world as an excellent tool which can speak. Business process flowcharts, diagrams and maps are used to define the business processes in terms of inputs and outputs, to visually represent and effectively explain complex business processes of an enterprise, and also showcase decisions on a single piece of paper. The process of business process mapping supposes the use of special business process flowchart symbols predefined by Business Process Modeling Notation (BPMN) and taking their roots from the data processing diagrams and programming flow charts. In other words the BPMN standard notation is a common language used for business process design and implementation, that guarantees a clarity of designed Business Process Flowcharts for all business analysts, technical developers and business managers.
The ability to create professionally-looking Business Process flowcharts, maps and diagrams, is provided by powerful ConceptDraw DIAGRAM software and the Business Process Mapping solution included to ConceptDraw Solution Park.
Drawing the diagrams we try to find in help the powerful software and now we have the ConceptDraw DIAGRAM. The ability easily create the SDL diagrams is made possible thanks to unique Specification and Description Language (SDL) Solution from the Industrial Engineering Area of ConceptDraw Solution Park. This solution extends ConceptDraw DIAGRAM libraries - SDL Connectors and SDL Diagrams that contain 70 predesigned SDL flowchart symbols.
Create value stream maps - for value stream analysis and value stream management, material and information flow mapping, using our quick start templates included with ConceptDraw.
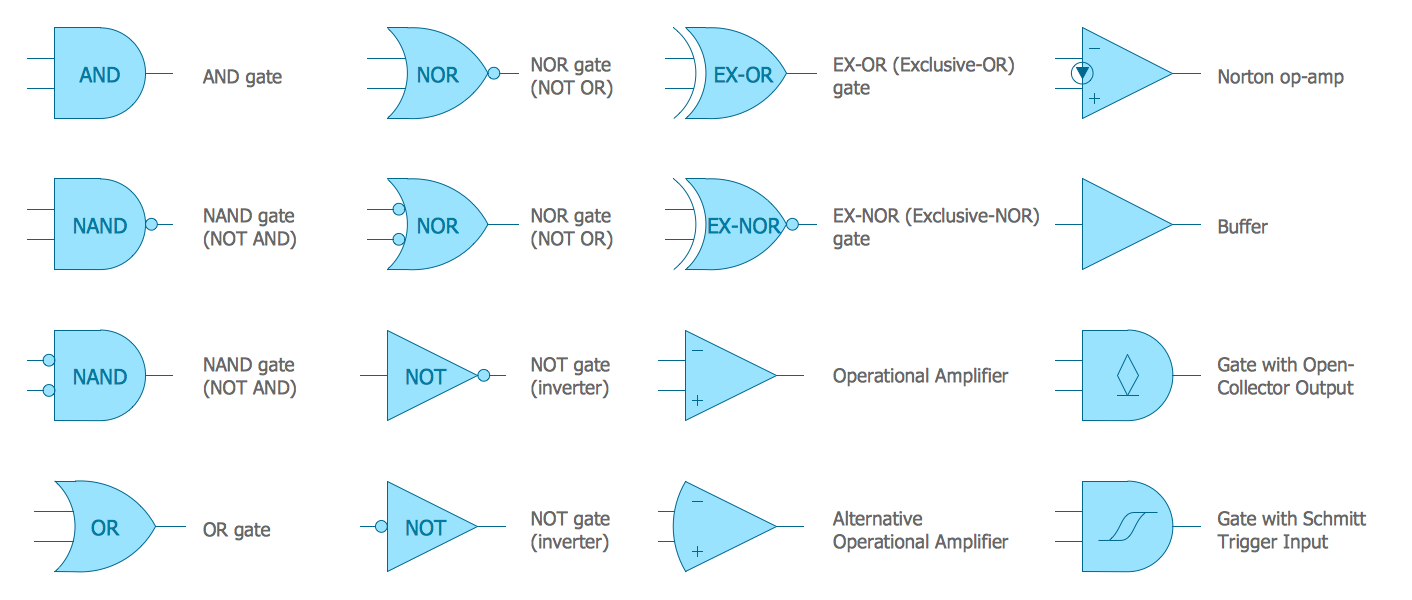
In electronics, a logic gate is an idealized or physical device implementing a Boolean function; that is, it performs a logical operation on one or more logical inputs, and produces a single logical output. Depending on the context, the term may refer to an ideal logic gate, one that has for instance zero rise time and unlimited fan-out, or it may refer to a non-ideal physical device
26 libraries of the Electrical Engineering Solution of ConceptDraw DIAGRAM make your electrical diagramming simple, efficient, and effective. You can simply and quickly drop the ready-to-use objects from libraries into your document to create the electrical diagram.