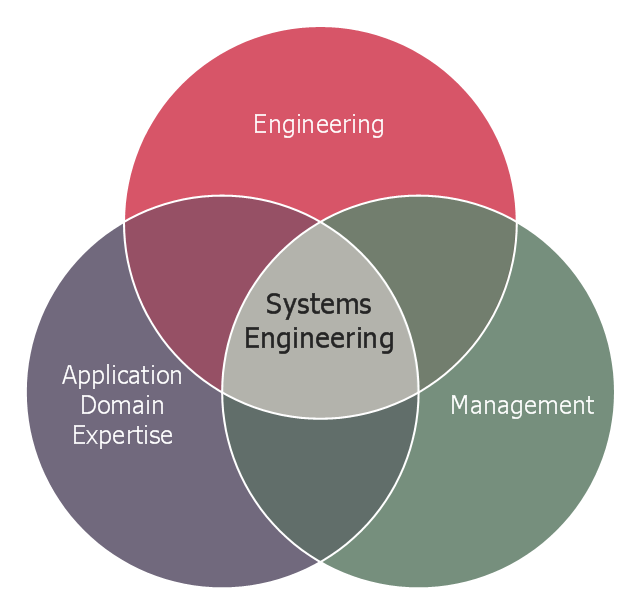
This Venn diagram sample shows the system engineering at the intersection of enginnering, management, and application domain expertise. It was designed on the base of the Venn diagram on the webpage "Intelligent Transportation Systems (ITS) ePrimer, Module 2: Systems Engineering" from the website of the Office of the Assistant Secretary for Research and Technology (OST-R), the U.S. Department of Transportation (US DOT).
"The term interdisciplinary is a fundamental concept in systems engineering. To successfully develop a system requires the application of basic engineering discipline, management discipline, and expertise in the application domain of the system. In the case of ITS, that application domain is transportation engineering. The intersection of these disciplines is the realm of systems engineering."
[pcb.its.dot.gov/ eprimer/ module2.aspx]
The Venn diagram example "Systems engineering improvement" was created using the ConceptDraw PRO diagramming and vector drawing software extended with the Venn Diagrams solution from the area "What is a Diagram" of ConceptDraw Solution Park.
Venn diagram
The FTA diagram sample "Fault tree analysis - Insulin delivery system" was redesigned from the illustration of "CMSI 641: Introduction to Software Engineering. Design of Critical Systems. B.J. Johnson. 2005. Loyola Marymount University".
"Another way of assessing hazards is using fault tree analysis. In this process, each of the identified hazards is covered by a detailed analysis to find out what might cause it. Either inductive or deductive reasoning is applied. In the case of software hazards, the usual focus is to determine faults that will cause the system to fail to deliver a system service, such as a monitoring system. A "fault tree" is constructed to link all the possible situations together, to help identify the interrelationships of the failures, which modules may cause them, and what "trickle-down effects" there might be. Here is an example of a fault tree, as applied to the Insulin delivery system from Sommerville...
Note that this tree is only partially complete, since only the potential software faults are shown on the diagram. The potential failures involving hardware, such as low battery, blood monitor or sensor failure, patient over-exertion or inattention, or medical staff failure are noticeable by their absence.
The fault tree and safety specification processes are two ways of helping with system risk assessment tasks. Once the risks are identified, there are other assessments that need to take place. First, the likelihood of the risk occurrance must be assessed. This is often quantifiable, so numbers may be assigned based on things like MTBF, latency effects, and other known entities. There may be other non-quantifiable contributors to the risk likelihood, however, such that these must be assessed and estimated by experts in the domain. (Don't short-change this process when dealing with critical systems!) Finally, the risk assessment must include the severity of the risk, meaning an estimation of the cost to the project in the event the risk item actually does occur. "Cost to the project" means all associated costs, including schedule delays, human injury, damage to hardware, corruption of data, and so on."
[myweb.lmu.edu/ bjohnson/ cmsi641web/ week15-2.html]
The FTA diagram example "Fault tree analysis - Insulin delivery system" was created using the ConceptDraw PRO diagramming and vector drawing software extended with the Fault Tree Analysis Diagrams solution from the Engineering area of ConceptDraw Solution Park.
FTA diagram

 SYSML
SYSML
The SysML solution helps to present diagrams using Systems Modeling Language; a perfect tool for system engineering.
How To use Switches in Network Diagram


- Systems engineering improvement | Venn Diagrams | Venn Diagram ...
- Intelligent transportation system | Vehicular Networking | Systems ...
- Venn Diagram Examples For Engineers
- ConceptDraw PRO ER Diagram Tool | DFD Library System | UML ...
- UML Class Diagram Example for Transport System
- Intelligent transportation system | Transportation Infographics | UML ...
- UML Class Diagram Example for Transport System
- Sequence Diagram On Machinary Shop Management System
- UML Use Case Diagram Example Registration System | UML ...
- SSADM Diagram | Process Flowchart | Structured Systems Analysis ...
- Data structure diagram with ConceptDraw PRO | Data Flow Diagram ...
- Design elements - Android system icons (maps) | Local area ...
- Entity Relatioship Diagram For Online Supermarket System
- Data Flow Diagram Symbols. DFD Library | DFD Library System ...
- UML Class Diagram Example for Transport System
- Semantic Data Diagram For Library Management System
- ConceptDraw PRO ER Diagram Tool | JSD - Jackson system ...
- DFD Library System | Data Flow Diagram | UML Deployment ...
- Specification and Description Language (SDL) | Types of Flowcharts ...
- Activity Diagram For Sports Event Management System