HelpDesk
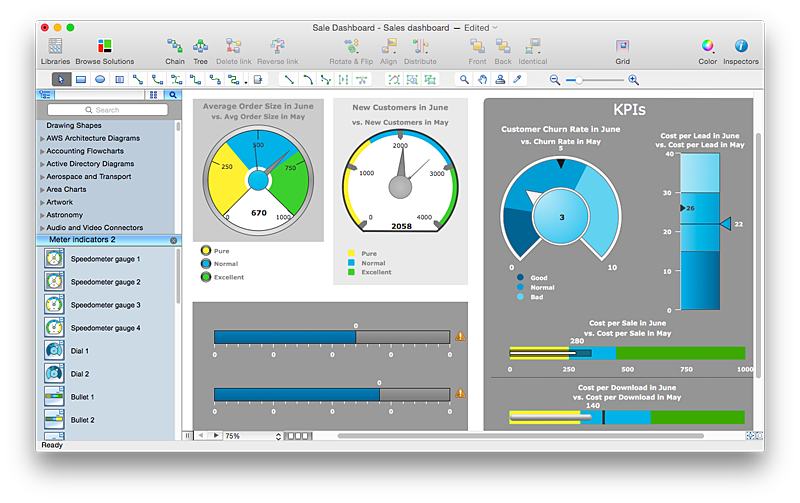
How to Connect Tabular Data (CSV) to a Graphic Indicator on Your Live Dashboard
The Time Series Dashboard Solution can be used to create the interactive Time Series Charts as Column Charts, Line Charts, or Bar Charts for your interactive dashboard.
 Basic Charts
Graphs and charts, such as Line Chart, Area Chart, Histogram, Scatter Diagram, Pie Chart, Donut Chart, Column Chart, Horizontal Bar Chart are the most popular and commonly used for representing the information and data in a visual graphical form, easy for perception.
- Composition Conversion Of Graphics Pie Chart Bar Chart Table
- Design elements - Tables | Symbol for Pool Table for Floor Plans ...
- How To Convert Data-driven Infographics to Adobe PDF Using ...
- Difference Between Algorithm And Flowchart In Table
- Performance Indicators | How to Connect Tabular Data (CSV) to a ...
- Seating Plans | Building Drawing Software for Design Seating Plan ...
- Management indicators - Vector stencils library | Education ...
- Design elements - Periodic table of chemical elements | Periodic ...
- Periodic table of chemical elements | Design elements - Periodic ...
- Management indicators - Vector stencils library | Sales performance ...
- Data Flow Diagram | How to Connect a Live Object to a Text Data ...
- Meter Dashboard | Basic Flowchart Symbols and Meaning | How to ...
- How to Connect Text Data to a Time Series Chart on Your Live ...
- Design elements - Periodic table of chemical elements | Design ...
- Timeline Examples | How to Make a Timeline | Timeline Diagrams ...
- Basic Flowchart Symbols and Meaning | Audit Flowchart Symbols ...
- Computer pictograms - Vector stencils library | Computer pictograms ...
- How to Connect Text Data to a Time Series Chart on Your Live ...
- A KPI Dashboard . Visualizing Sales Data. To See How Your | Meter ...
- Timeline Diagrams | How to Create a Timeline Diagram in ...
