Data Flow Diagram Model
Data Flow Diagram (DFD) is a technique of graphical structural analysis, describing the sources external to the system, recipients of data, also logical functions, data flows and data stores that are accessed. The DFD's goal is to show how each process converts its inputs into the outputs and to identify relationships between these processes, at this make the system's description clear and understandable at every level of detail. Historically happened that for describing Data Flow Diagrams are used two notations - Yourdon and Gane-Sarson that differ each from other by graphical representation of symbols. The DFD model, like most other structural models is a hierarchical model. Each process can be subjected to decomposition on the structural components, the relationships between which in the same notation can be shown on a separate diagram. Typically, several DFD models are built when modeling the system. ConceptDraw DIAGRAM software enhanced with Data Flow Diagrams solution ideally suits for creation DFD models and professional drawing Data Flow Diagrams.HelpDesk
How to Purchase and Install ConceptDraw Solution Packages
This article will guide you through purchasing, downloading and installing a ConceptDraw Solutions bundle. You can Create striking illustrations in a range of themes or styles, by using ConceptDraw DIAGRAM powerful drawing tools and the vector stencil libraries provided with the downloaded bundles solutions.
 Winter Sports
The Winter Sports solution from Sport area of ConceptDraw Solution Park contains winter sports illustration examples, templates and vector clipart libraries.
 Business Process Diagrams
Business Process Diagrams solution extends the ConceptDraw DIAGRAM BPM software with RapidDraw interface, templates, samples and numerous libraries based on the BPMN 1.2 and BPMN 2.0 standards, which give you the possibility to visualize equally easy simple and complex processes, to design business models, to quickly develop and document in details any business processes on the stages of project’s planning and implementation.
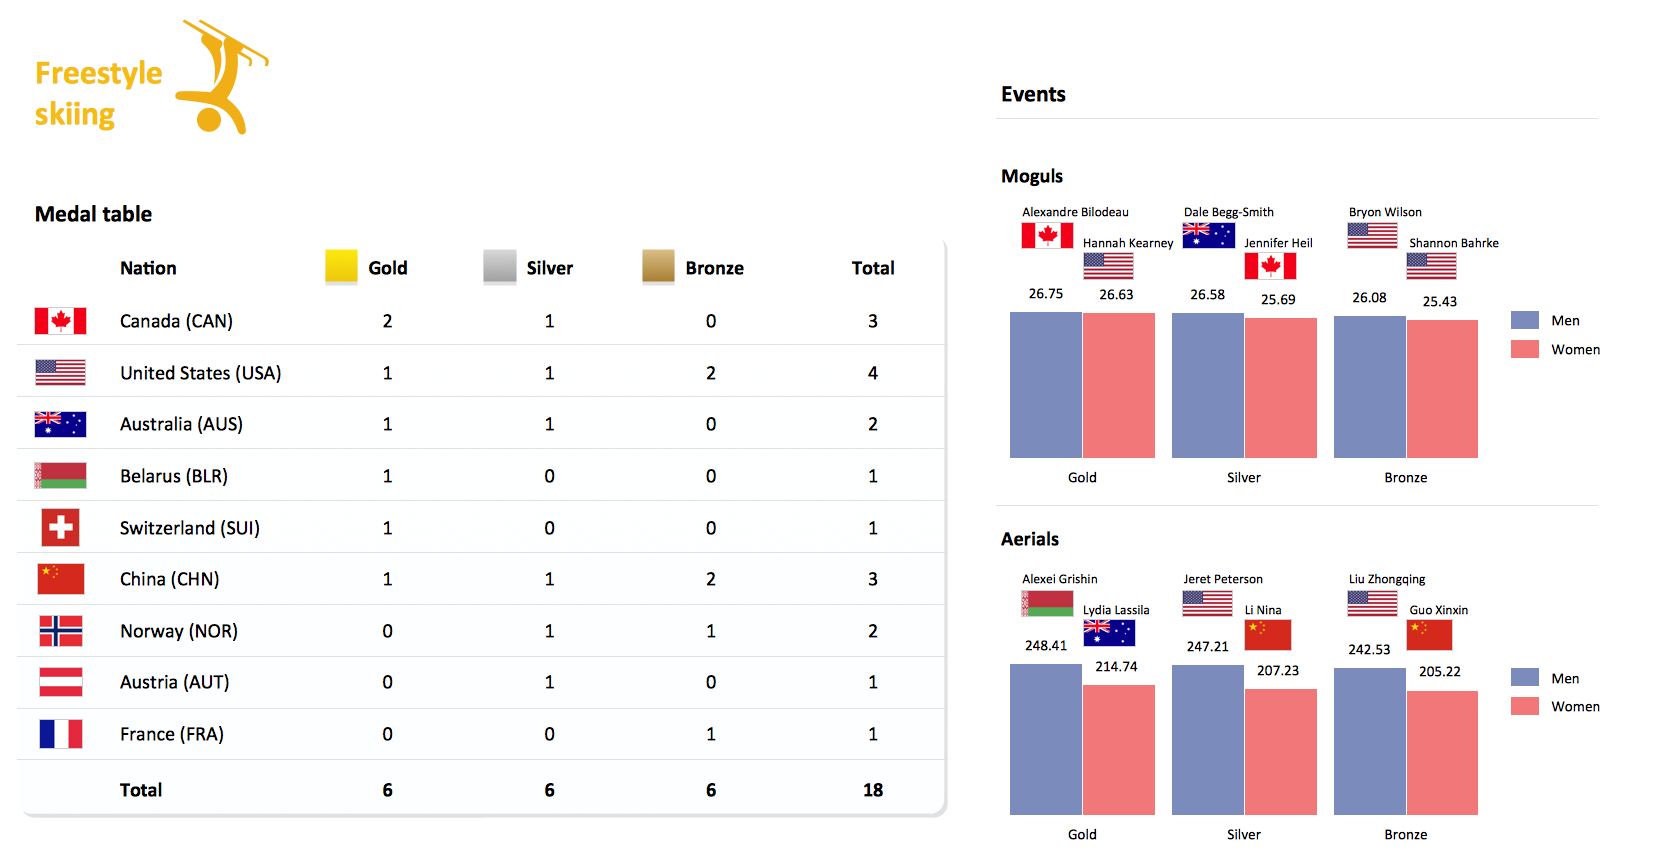
Winter Sports. Olympic Games Illustrations. Medal Summary
Do you like infographics and data visualization? Creating infographics is super-easy with ConceptDraw.Baseball — Pitching and the Strike Zone
Visual depiction is key secret to successful understanding baseball strike zone dimentions. Baseball strike zone diagram illustrated using ConceptDraw DIAGRAM software enhanced with the Baseball solution from the ConceptDraw Solution Park.
 Business Package for Management
Package intended for professional who designing and documenting business processes, preparing business reports, plan projects and manage projects, manage organizational changes, prepare operational instructions, supervising specific department of an organization, workout customer service processes and prepare trainings for customer service personal, carry out a variety of duties to organize business workflow.
Seven Basic Tools of Quality — Quality Control
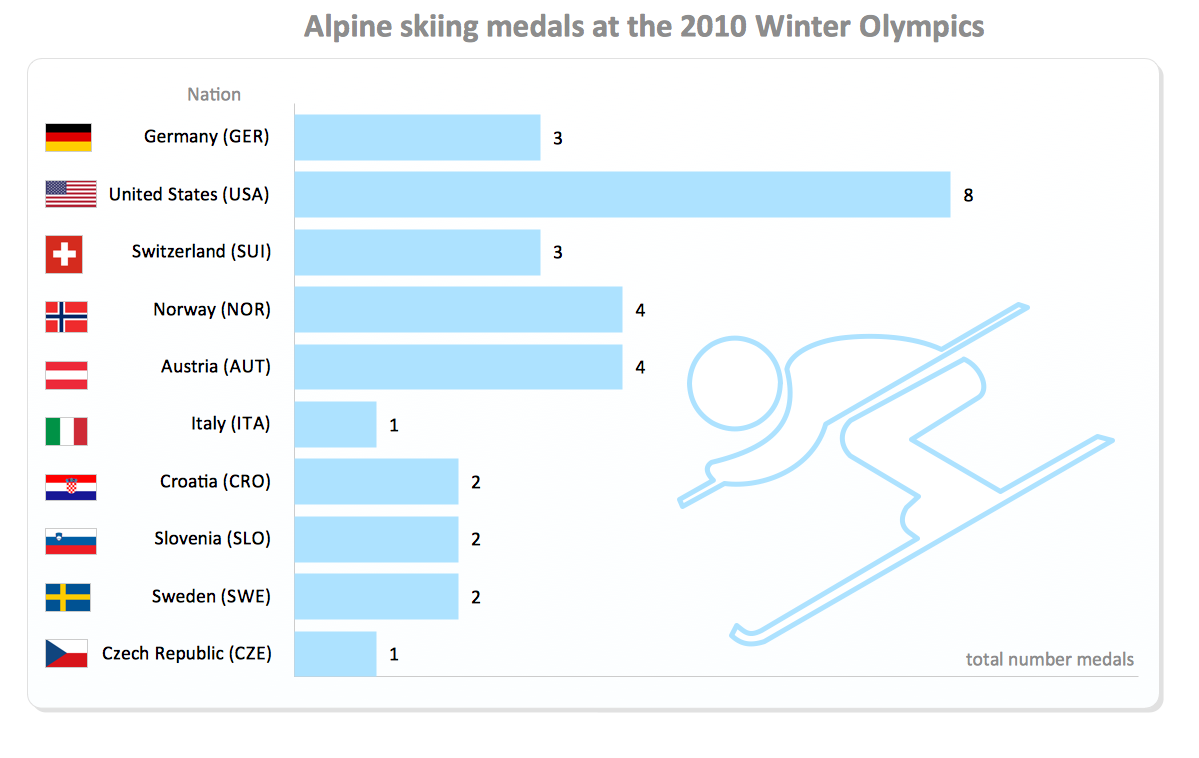
ConceptDraw DIAGRAM diagramming and vector drawing software extended with Seven Basic Tools of Quality solution from the Quality area of ConceptDraw Solution Park provides effective tools for quality control and helps design any types of quality-related diagrams.Winter Sports. Illustrations and Visualize Statistics
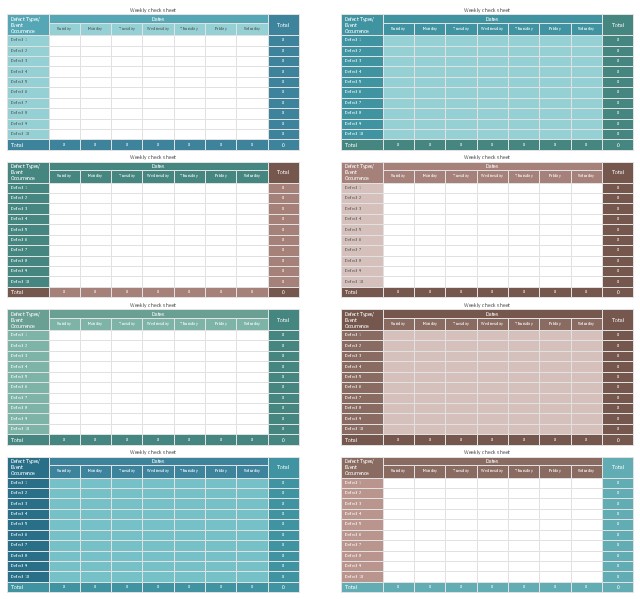
Visualizing sports statistics becomes as easy as never before with ConceptDraw DIAGRAM software extended with the Winter Sports solution. This solution delivers a complete set of winter sports illustrations, samples and templates you may use to visualize any kind of sports statistics in minutes.The vector stencils library "Check sheet" contains 8 templates of weekly check sheet.
Use it to design your check sheets with ConceptDraw PRO diagramming and vector drawing software.
"The check sheet is a form (document) used to collect data in real time at the location where the data is generated. The data it captures can be quantitative or qualitative. When the information is quantitative, the check sheet is sometimes called a tally sheet.
The check sheet is one of the so-called Seven Basic Tools of Quality Control." [Check sheet. Wikipedia]
The example of check sheet templates "Design elements - Check sheet" is included in the Seven Basic Tools of Quality solution from the Quality area of ConceptDraw Solution Park.
- Invoice payment process - Flowchart | Accounting Flowchart ...
- Fishbone Diagrams | How Do Fishbone Diagrams Solve ...
- Cross-Functional Flowchart | Basic Flowchart Symbols and Meaning ...
- Check sheet for motor assembly | Seven Basic Tools of Quality ...
- Design elements - Marketing pictograms | Management indicators ...
- Sport pictograms. Olympic Games | Design elements - Winter ...
- Histogram - Template | Normal distribution graph - Template ...
- Design elements - Hydraulic pumps and motors | Pneumatic pumps ...
- Design elements - Winter sports pictograms | Snowboard - Winter ...


