Chart Templates

This data-driven infographic example was redesigned from the Wikimedia Commons file: Effects of tax and benefits on household income in the UK 2011 - 2012.png.
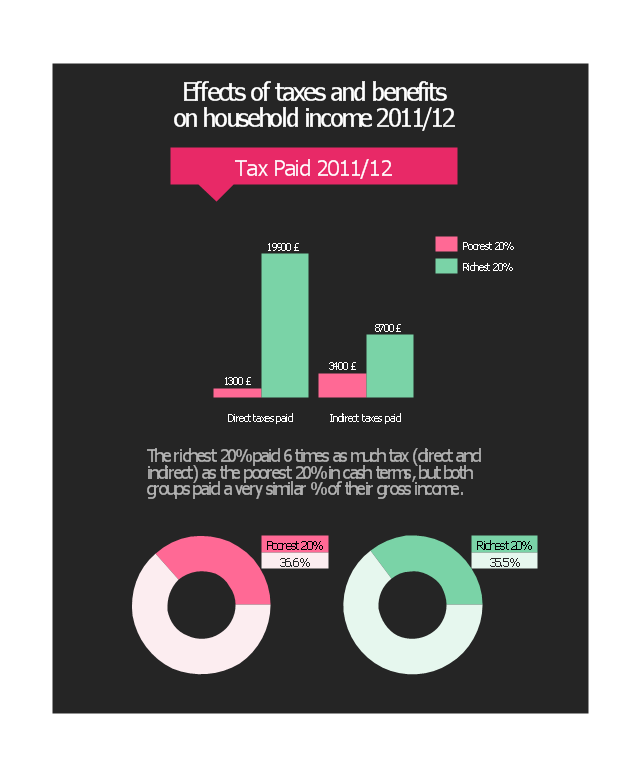
"Before taxes and benefits, the richest fifth of households had an average income of £78,300 in 2011/ 12, 14 times greater than the poorest fifth, who had an average income of £5,400.
Overall, taxes and benefits lead to income being shared more equally between households. After all taxes and benefits are taken into account, the ratio between the average incomes of the top and the bottom fifth of households (£57,300 per year and £15,800 respectively) is reduced to four-to-one."
[commons.wikimedia.org/ wiki/ File:Effects_ of_ tax_ and_ benefits_ on_ household_ income_ in_ the_ UK_ 2011_ -_ 2012.png]
The bar graph and donut chart sample "Effects of taxes and benefits" was created using the ConceptDraw PRO diagramming and vector graphics software extended with the Data-driven Infographics" solution from the area "What is infographics" of ConceptDraw Solution Park.
Data-driven infographics
Audit Flowchart Symbols

Pyramid Diagram

Scatter Graph Charting Software

Use a Fishbone Diagram to Attack Complex Problems

Financial Trade UML Use Case Diagram Example

Geo Map — USA — Montana

Flow Chart Symbols

- Vector For Benefits Png
- HR workflow - Vector stencils library | Hiring process workflow ...
- Tax Org Chart Symbols
- HR workflow - Vector stencils library | Accounting Flowcharts ...
- HR workflow - Vector stencils library | Business people - Vector ...
- Bank Branch Icon Png
- Business - Vector stencils library | Shake Hand Vector Png
- HR workflow - Vector stencils library | HR Flowcharts | Electronic ...
- Employee Icon Png
- HR workflow - Vector stencils library