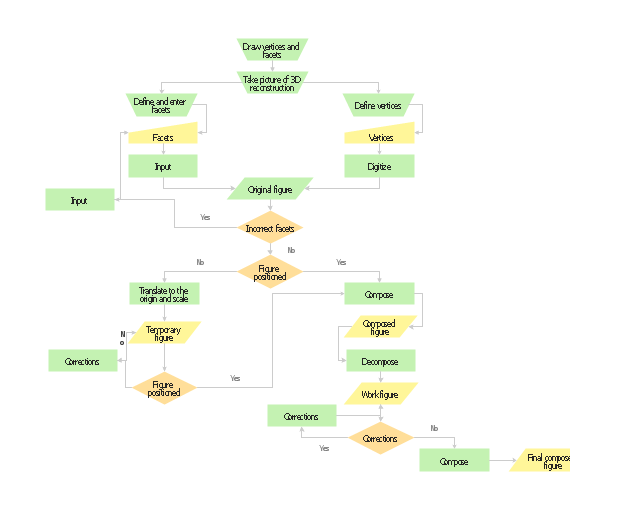
Planning scheme for the construction of a synthetic object.
"Computer-generated imagery (CGI) ... is the application of computer graphics to create or contribute to images in art, printed media, video games, films, television programs, commercials, and simulators. The visual scenes may be dynamic or static, and may be two-dimensional (2D), though the term "CGI" is most commonly used to refer to 3D computer graphics used for creating scenes or special effects in films and television." [Computer-generated imagery. Wikipedia]
The flow chart example "Synthetic object construction" was created using the ConceptDraw PRO diagramming and vector drawing software extended with the Flowcharts solution from the area "What is a Diagram" of ConceptDraw Solution Park.
Business diagrams & Org Charts with ConceptDraw DIAGRAM
The business diagrams are in great demand, they describe the business processes, business tasks and activities which are executed to achieve specific organizational and business goals, increase productivity, reduce costs and errors. They let research and better understand the business processes. ConceptDraw DIAGRAM is a powerful professional cross-platform business graphics and business flowcharting tool which contains hundreds of built-in collections of task-specific vector stencils and templates. They will help you to visualize and structure information, create various Business flowcharts, maps and diagrams with minimal efforts, and add them to your documents and presentations to make them successful. Among them are Data flow diagrams, Organization charts, Business process workflow diagrams, Audit flowcharts, Cause and Effect diagrams, IDEF business process diagrams, Cross-functional flowcharts, PERT charts, Timeline diagrams, Calendars, Marketing diagrams, Pyramids, Target diagrams, Venn diagrams, Comparison charts, Analysis charts, Dashboards, and many more. Being a cross-platform application, ConceptDraw DIAGRAM is very secure, handy, free of bloatware and one of the best alternatives to Visio for Mac users.
Spatial infographics Design Elements: Location Map
Infographic Design Elements for visually present various geographically distributed information.
 Audio, Video, Media
Use it to make professional-looking documents, impressive presentations, and efficient websites with colorful and vivid illustrations and schematics of digital audio, video and photo gadgets and devices, audio video connections and configurations, S Video connection, HD and 3D television systems, home entertainment systems, Closed-circuit television (CCTV) surveillance systems. All audio video schematics, drawings and illustrations designed in ConceptDraw DIAGRAM are professional looking, clear and understandable for all thanks to applying the most commonly used standards of designations, and are effective for demonstrating in front of a small audience and on the big screens.
- Wiring Diagrams with ConceptDraw PRO | Flowchart Examples and ...
- Flowchart Examples For Television
- How To use House Electrical Plan Software | Database Flowchart ...
- Process Flowchart | ConceptDraw PRO The best Business Drawing ...
- Flow Charts And Algorithm Of Television
- Process Flowchart | Flow Chart Diagram Examples | Create a Flow ...
- Process Flowchart | Flowchart Examples and Templates | How To ...
- Process Flowchart | How to Draw an Organization Chart | How To ...
- Example of Flowchart Diagram | Process Flowchart | Synthetic object ...
- Cloud Computing Architecture Diagrams | Definition Flowchart ...
- Process Flowchart | Process Flow Diagram Symbols | Design ...
- Device A Flow Chart For Layout Flow Charts In Management
- Synthetic object construction - Flowchart | Flow Chart Diagram ...
- Flowcharts | Process Flowchart | Audit Flowcharts | Flowchart Of ...
- Process Flowchart | Line Graph Charting Software | Flowchart ...
- Process Flowchart | Structured Systems Analysis and Design ...
- Basic Flowchart Symbols and Meaning | Process Flowchart ...
- How To use House Electrical Plan Software | Basic Flowchart ...
- Synthetic object construction - Flowchart | Process Flowchart | Flow ...
- Basic Flowchart Symbols and Meaning | Process Flowchart | ERD ...


