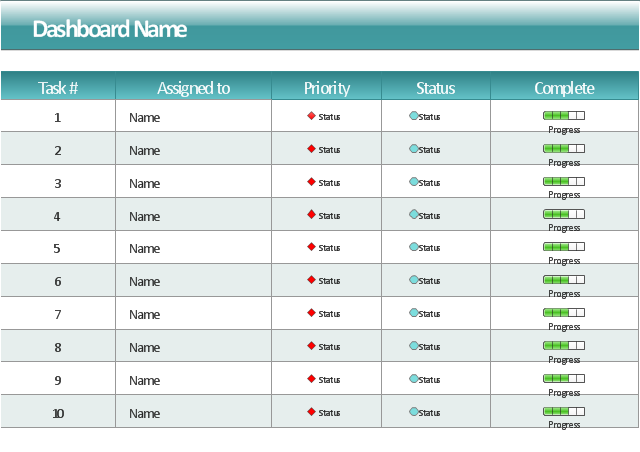
This project task status dashboard template display the task table consisting of the columns for task number, assignment (responsible person name), priority, status and complete. The task priority and status are indicated with alert visual indicators. The task complete is showed by progress indicators.
The template "Project task status dashboard" for the ConceptDraw PRO diagramming and vector drawing software is included in the Status Dashboard solution from the area "What is a Dashboard" of ConceptDraw Solution Park.
The template "Project task status dashboard" for the ConceptDraw PRO diagramming and vector drawing software is included in the Status Dashboard solution from the area "What is a Dashboard" of ConceptDraw Solution Park.
Project task status dashboard template
 Status Dashboard
Status dashboard solution extends ConceptDraw DIAGRAM software with templates, samples and vector stencils libraries with graphic indicators for drawing the visual dashboards showing status data.
HelpDesk
How to Create a Sales Dashboard

 Business Intelligence Dashboard
Business Intelligence Dashboard solution extends the ConceptDraw DIAGRAM functionality with exclusive tools, numerous ready-to-use vector objects, samples and quick-start templates for creation professional Business Intelligence Dashboards, Business Intelligence Graphics, Business Intelligence Charts and Maps of different kinds. Design easy the BI dashboard, BI model or Dynamic chart in ConceptDraw DIAGRAM to monitor the company's work, to track the indicators corresponding your company's data, to display and analyze key performance indicators, to evaluate the trends and regularities of the processes occurring at the company.
 Chemistry
This solution extends ConceptDraw DIAGRAM software with samples, template and libraries of vector stencils for drawing the Chemistry Illustrations for science and education.
 Seating Plans
The Seating Plans solution including samples, seating chart templates and libraries of vector design elements assists in creating the Seating plans, Seating arrangement charts, Chair layout designs, Plan drawings of cinema seating, Movie theater chair plans, extensive Cinema theater plans depicting the seating arrangement in the cinema halls, location of closet, cafe and food sale area, in designing the Seating plans for the large seating areas, Seat plan designs for airplanes, trains, etc. Use any of the included samples as the table seating chart template or seating chart template free and achieve professional drawing results in a few minutes.
 Scatter Diagrams
The Scatter Diagrams solution extends ConceptDraw DIAGRAM functionality with templates, samples, and a library of vector stencils that make construction of a Scatter Plot easy. The Scatter Chart Solution makes it easy to design attractive Scatter Diagrams used in various fields of science, work, and life activities. ConceptDraw DIAGRAM lets you enter the data to the table and construct the Scatter Plot Graph automatically according to these data.
HelpDesk
How to Track Your Project Plan vs. the Actual Project Condition

Ansoff Matrix

 Cafe and Restaurant Floor Plans
Restaurants and cafes are popular places for recreation, relaxation, and are the scene for many impressions and memories, so their construction and design requires special attention. Restaurants must to be projected and constructed to be comfortable and e
 Cooking Recipes
Create quick and easy recipe diagrams with the Cooking Recipes solution. Make a tasty meal for dinner, for holidays, or for a party.
SWOT Matrix Template

 Entity-Relationship Diagram (ERD)
An Entity-Relationship Diagram (ERD) is a visual presentation of entities and relationships. That type of diagrams is often used in the semi-structured or unstructured data in databases and information systems. At first glance ERD is similar to a flowch
 Floor Plans
Construction, repair and remodeling of the home, flat, office, or any other building or premise begins with the development of detailed building plan and floor plans. Correct and quick visualization of the building ideas is important for further construction of any building.
 School and Training Plans
School and Training Plans solution enhances ConceptDraw DIAGRAM functionality with extensive drawing tools, numerous samples and examples, templates and libraries of classroom design elements for quick and professional drawing the School and Training plans, School Floor plans, Classroom Layout, Classroom Seating chart, Lecture Room plans of any complexity. Each offered classroom seating chart template is a real help for builders, designers, engineers, constructors, as well as teaching personnel and other teaching-related people in drawing Classroom Seating charts and Training Room layouts with ConceptDraw DIAGRAM classroom seating chart maker.
- Marketing | PM Agile | Comparison Dashboard | Comparison Table ...
- PM Easy | Project task status dashboard - Template | Process ...
- Table Dashboard
- Status Dashboard | Project task status dashboard - Template | Entity ...
- PM Easy | Project task status dashboard - Template | AWS simple ...
- Design elements - Tables | Gantt Chart Software | Table Seating ...
- Status Dashboard | Project task status dashboard - Template ...
- Status Dashboard | PM Dashboards | Project task status dashboard ...
- Project task status dashboard - Template
- Project task status dashboard - Template | Sales Dashboard ...
- Project task status dashboard - Template | Status Dashboard | How ...
- Project task status dashboard - Template | Status Dashboard ...
- Software Project Dashboard Template
- Sales Dashboard Template | Project task status dashboard ...
- Project task status dashboard - Template | Project tasks dashboard ...
- Status Dashboard | Project management task status dashboard ...
- Frequency Histogram Template
- Swot Table Template
- Project tasks dashboard | Project task status dashboard - Template ...
- Status Dashboard | PM Dashboards | Comparison Dashboard | Free ...