Circular Flow Diagram Template
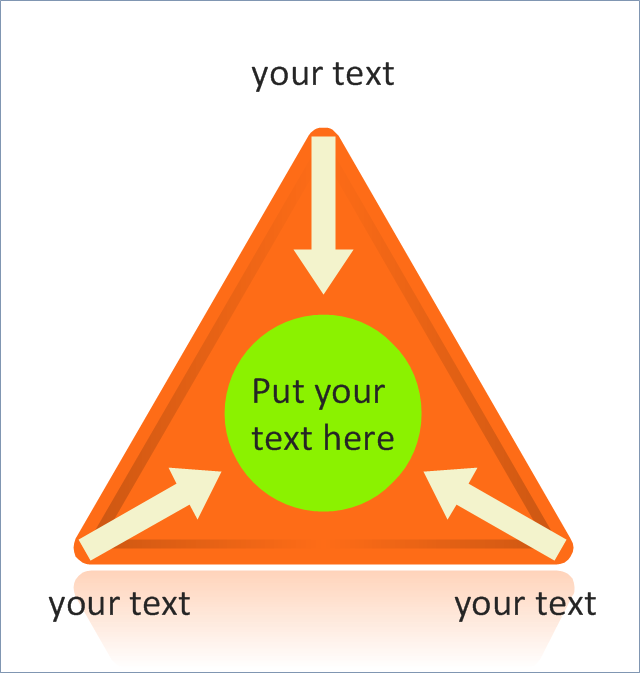
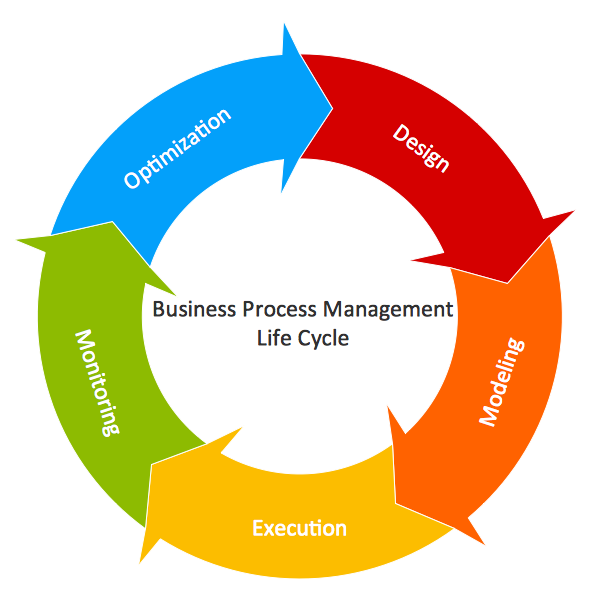
You need to draw the Circular Arrows Diagram, Segmented Diagram or Circular Flow Diagram? Any of these diagrams can be fast and easy designed in ConceptDraw PRO.ConceptDraw PRO diagramming and vector drawing software offers the Circular Arrows Diagrams Solution from the "Diagrams" Area with extensive drawing tools, predesigned samples and circular flow diagram template. Use of ready template is the easiest way of drawing.Use this triangle chart template to create your own marketing triangular schemes using the ConceptDraw PRO diagramming and vector drawing software.
The template "Triangle scheme with arrows" is included in the Pyramid Diagrams solution from the Marketing area of ConceptDraw Solution Park.
www.conceptdraw.com/ solution-park/ marketing-pyramid-diagrams
The template "Triangle scheme with arrows" is included in the Pyramid Diagrams solution from the Marketing area of ConceptDraw Solution Park.
www.conceptdraw.com/ solution-park/ marketing-pyramid-diagrams
Circular Arrows
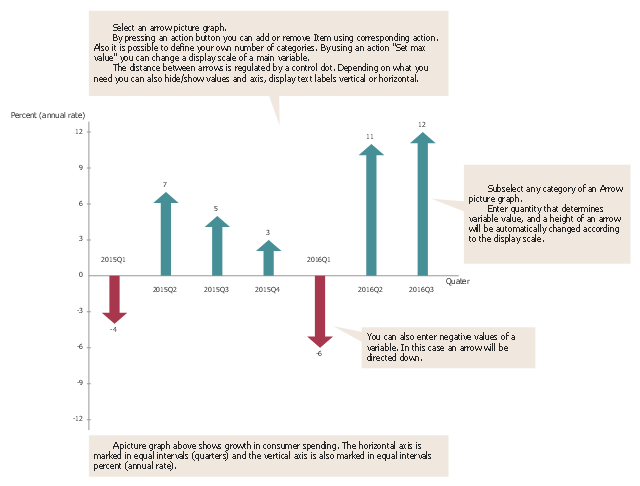
The Circular Arrows Diagrams are very popular in management and marketing. They are the useful way to visualize a sequence of steps, tasks, or events as a circular flow. But how design the Circular Arrows Diagram quick and easy? You will need a powerful software. ConceptDraw PRO diagramming and vector drawing software is exactly what you need. Extended with Circular Arrows Diagrams solution from the "Diagrams" Area, ConceptDraw PRO is the best for drawing the Circular Arrows Diagrams.A picture chart (image chart, pictorial graph) is the type of a bar graph visualizing numarical data using symbols and pictograms.
In the field of economics and finance use a picture graph with columns in the form of coins. For population comparison statistics use a chart with columns in the form of manikins. To show data increase or decrease use arrows bar charts.
The picture graph template for the ConceptDraw PRO diagramming and vector drawing software is included in the Picture Graphs solution from the Graphs and Charts area of ConceptDraw Solution Park.
Circular Arrow
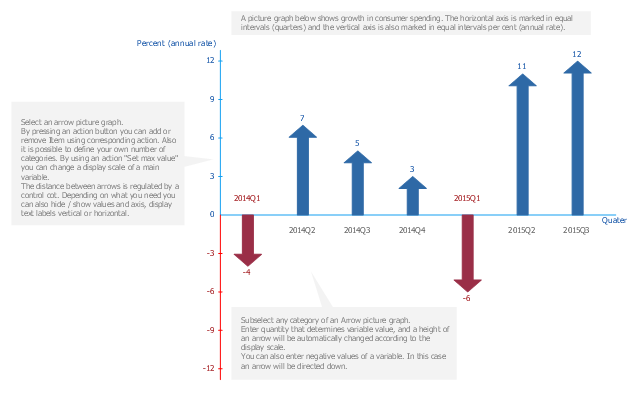
ConceptDraw PRO diagramming and vector drawing software extended with Circular Arrows Diagrams solution from the "Diagrams" Area is a powerful software that will help you design professional looking Circular Arrow Diagrams.A picture chart (image chart, pictorial graph) is the type of a bar graph visualizing numarical data using symbols and pictograms.
In the field of economics and finance use a picture graph with columns in the form of coins. For population comparison statistics use a chart with columns in the form of manikins. To show data increase or decrease use arrows bar charts.
The arrow chart template "Picture graph" for the ConceptDraw PRO diagramming and vector drawing software is included in the Basic Picture Graphs solution from the Graphs and Charts area of ConceptDraw Solution Park.
Basic Flowchart Symbols and Meaning
Flowcharts are the best for visually representation the business processes and the flow of a custom-order process through various departments within an organization. ConceptDraw PRO diagramming and vector drawing software extended with Flowcharts solution offers the full set of predesigned basic flowchart symbols which are gathered at two libraries: Flowchart and Flowcharts Rapid Draw. Among them are: process, terminator, decision, data, document, display, manual loop, and many other specific symbols. The meaning for each symbol offered by ConceptDraw gives the presentation about their proposed use in professional Flowcharts for business and technical processes, software algorithms, well-developed structures of web sites, Workflow diagrams, Process flow diagram and correlation in developing on-line instructional projects or business process system. Use of ready flow chart symbols in diagrams is incredibly useful - you need simply drag desired from the libraries to your document and arrange them in required order. There are a few serious alternatives to Visio for Mac, one of them is ConceptDraw PRO. It is one of the main contender with the most similar features and capabilities.
 Circular Arrows Diagrams
Circular Arrows Diagrams solution extends ConceptDraw PRO v10 with extensive drawing tools, predesigned samples, Circular flow diagram template for quick start, and a library of ready circular arrow vector stencils for drawing Circular Arrow Diagrams, Segmented Cycle Diagrams, and Circular Flow Diagrams. The elements in this solution help managers, analysts, business advisers, marketing experts, scientists, lecturers, and other knowledge workers in their daily work.
Flowcharting Software
A flowchart is a useful type of diagram quite popular in many areas of science and business, which represents some algorithm, workflow or process. ConceptDraw PRO diagramming and vector graphic software extended with Flowcharts solution from the "Diagrams" area of ConceptDraw Solution Park is also ideal flowcharting software with powerful tools that assist in easily making the Flowcharts of different types and directions, in representing the flowchart steps and describing the flowchart processes, in realizing the flowchart constructions, creating the process flow models, designing the data flow diagrams, and many other flowcharting related diagrams. ConceptDraw PRO software maximally facilitates the drawing process by means of included predesigned vector objects, which only need to be dragged to your ConceptDraw document from the corresponding library and connected with smart connectors. This way lets equally easy make the simple flowcharts, as well as flowcharts of complex processes and procedures.Process Flowchart
The main reason of using Process Flowchart or PFD is to show relations between major parts of the system. Process Flowcharts are used in process engineering and chemical industry where there is a requirement of depicting relationships between major components only and not include minor parts. Process Flowcharts for single unit or multiple units differ in their structure and implementation. ConceptDraw PRO is Professional business process mapping software for making Process flowcharts, Process flow diagram, Workflow diagram, flowcharts and technical illustrations for business documents and also comprehensive visio for mac application. Easier define and document basic work and data flows, financial, production and quality management processes to increase efficiency of your business with ConcepDraw PRO. Business process mapping software with Flowchart Maker ConceptDraw PRO includes extensive drawing tools, rich examples and templates, process flowchart symbols and shape libraries, smart connectors that allow you create the flowcharts of complex processes, process flow diagrams, procedures and information exchange. Process Flowchart Solution is project management workflow tools which is part ConceptDraw Project marketing project management software. Drawing charts, diagrams, and network layouts has long been the monopoly of Microsoft Visio, making Mac users to struggle when needing such visio alternative like visio for mac, it requires only to view features, make a minor edit to, or print a diagram or chart. Thankfully to MS Visio alternative like ConceptDraw PRO software, this is cross-platform charting and business process management tool, now visio alternative for making sort of visio diagram is not a problem anymore however many people still name it business process visio tools.
HelpDesk
How to Draw a Circular Arrows Diagram Using ConceptDraw PRO
The cyclic recurrence is a fundamental property of multiple systems. The cycle is a process which consists from elements (phases, stages, stages) following each other. Many processes in astronomy, biology, chemistry, physics, mathematics, etc. have a cycle properties. It is also widely used in information technologies and marketing analysis. Graphical representation of cyclic processes can have many forms. It can be a circle, parabola, hyperbola, ellipse and others. A Circular Arrows Diagram is used as one of the statistical charts in the business, mass media and marketing. ConceptDraw PRO provides its users tools for making easy drawing Circular Arrows Diagrams.IDEF3 Standard
Use Case Diagrams technology. IDEF3 Standard is intended for description and further analysis of technological processes of an enterprise. Using IDEF3 standard it is possible to examine and model scenarios of technological processes.Cross-Functional Process Map Template
When you need a drawing software to create a professional looking cross-functional charts, ConceptDraw with its Arrows10 Technology - is more than enough versatility to draw any type of diagram with any degree of complexity. Use templates with process maps, diagrams, charts to get the drawing in minutes.The vector stencils library "Circular arrows diagrams" contains 20 templates of circular arrows diagrams and arrow donut charts.
Use these shapes to draw your circular arrows diagrams in the ConceptDraw PRO diagramming and vector drawing software.
The vector stencils library "Circular arrows diagrams" is included in the Circular Arrows Diagrams solution from the area "What is a Diagram" of ConceptDraw Solution Park.
Use these shapes to draw your circular arrows diagrams in the ConceptDraw PRO diagramming and vector drawing software.
The vector stencils library "Circular arrows diagrams" is included in the Circular Arrows Diagrams solution from the area "What is a Diagram" of ConceptDraw Solution Park.
- Circular Flow Diagram Template | Circular Arrow | Circular Arrows ...
- Arrow circle chart - Template | Basic Flowchart Symbols and ...
- Circular Flow Diagram Template | Circular Arrow | Circular Arrows ...
- Circular Arrow Template
- Circular Flow Diagram Template
- Circular Arrows Diagrams | What is a Diagram Area | Arrow circle ...
- Circular Flow Diagram Template | Circular Arrows | Pyramid ...
- Circular Flow Diagram Template | Circular Diagram | Circular Arrows ...
- How to Draw a Circular Arrows Diagram Using ConceptDraw PRO ...
- Circular Flow Diagram Template | Circular Arrow | Circular Arrows ...
- Circular diagrams - Vector stencils library | Circular arrows diagrams ...
- Circle Arrow Graph
- Circular Flow Diagram Template | Circular Arrows | ConceptDraw ...
- Pie Chart Examples and Templates | Arrow circle chart - Template ...
- Circular Flow Diagram Template | Circular Arrows Diagrams ...
- Circle Spoke Diagram Template | How to Draw a Circular Arrows ...
- Circular Arrow Powerpoint Template
- Picture graph - Template
- Triangle scheme with arrows - Template | Pyramid Diagram ...

