Types of Flowcharts
A Flowchart is a graphical representation of process, algorithm, workflow or step-by-step solution of the problem. It shows the steps as boxes of various kinds and connects them by arrows in a defined order depicting a flow. There are twelve main Flowchart types: Basic Flowchart, Business Process Modeling Diagram (BPMN), Cross Functional Flowchart, Data Flow Diagram (DFD), IDEF (Integrated DEFinition) Flowchart, Event-driven Process Chain (EPC) Diagram, Influence Diagram (ID), Swimlane Flowchart, Process Flow Diagram (PFD), Specification and Description Language (SDL) Diagram, Value Stream Mapping, Workflow Diagram. Using the Flowcharts solution from the Diagrams area of ConceptDraw Solution Park you can easy and quickly design a Flowchart of any of these types. This solution offers a lot of special predesigned vector symbols for each of these widely used notations. They will make the drawing process of Flowcharts much easier than ever. Pay also attention for the included collection of ready Flowchart examples, samples and quick-start templates. This is business process improvement tools. If you are looking for MS Visio for your Mac, then you are out of luck, because it hasn't been released yet. However, you can use Visio alternatives that can successfully replace its functions. ConceptDraw DIAGRAM is an alternative to MS Visio for Mac that provides powerful features and intuitive user interface for the same.
Competitor Analysis
Competitor analysis is a first and obligatory step in elaboration the proper corporate marketing strategy and creating sustainable competitive advantage. Use powerful opportunities of numerous solutions from ConceptDraw Solution Park for designing illustrative diagrams, charts, matrices which are necessary for effective competitor analysis.
 25 Typical Orgcharts
The 25 Typical Orgcharts solution contains powerful organizational structure and organizational management drawing tools, a variety of professionally designed organization chart and matrix organization structure samples, 25 templates based on various orga
SWOT Template
The SWOT and TOWS Matrix Diagrams solution from the ConceptDraw Solution Park gives a simple visual support for all steps of a SWOT analysis process, which is a popular strategic planning method used to evaluate the Strengths, Weaknesses, as well as Opportunities and Threats facing a project. Strengths are the project's characteristics giving it the advantages over the others, weaknesses are the characteristics placing the team at the disadvantage relatively to others, opportunities are the elements that the project can exploit to its advantage and threats are the elements that can cause the troubles. The results of a correctly performed SWOT analysis help to achieve effectively the main objective. The SWOT templates included to SWOT and TOWS Matrix Diagrams solution for ConceptDraw DIAGRAM isually support the identifying of internal and external factors that are favorable or unfavorable. Making the SWOT analysis and completing the SWOT Matrix by simple filling a SWOT template, you can then export it to large variety of available formats: PowerPoint presentation, PDF, image files, and others.Diagramming Software for Design UML Object Diagrams
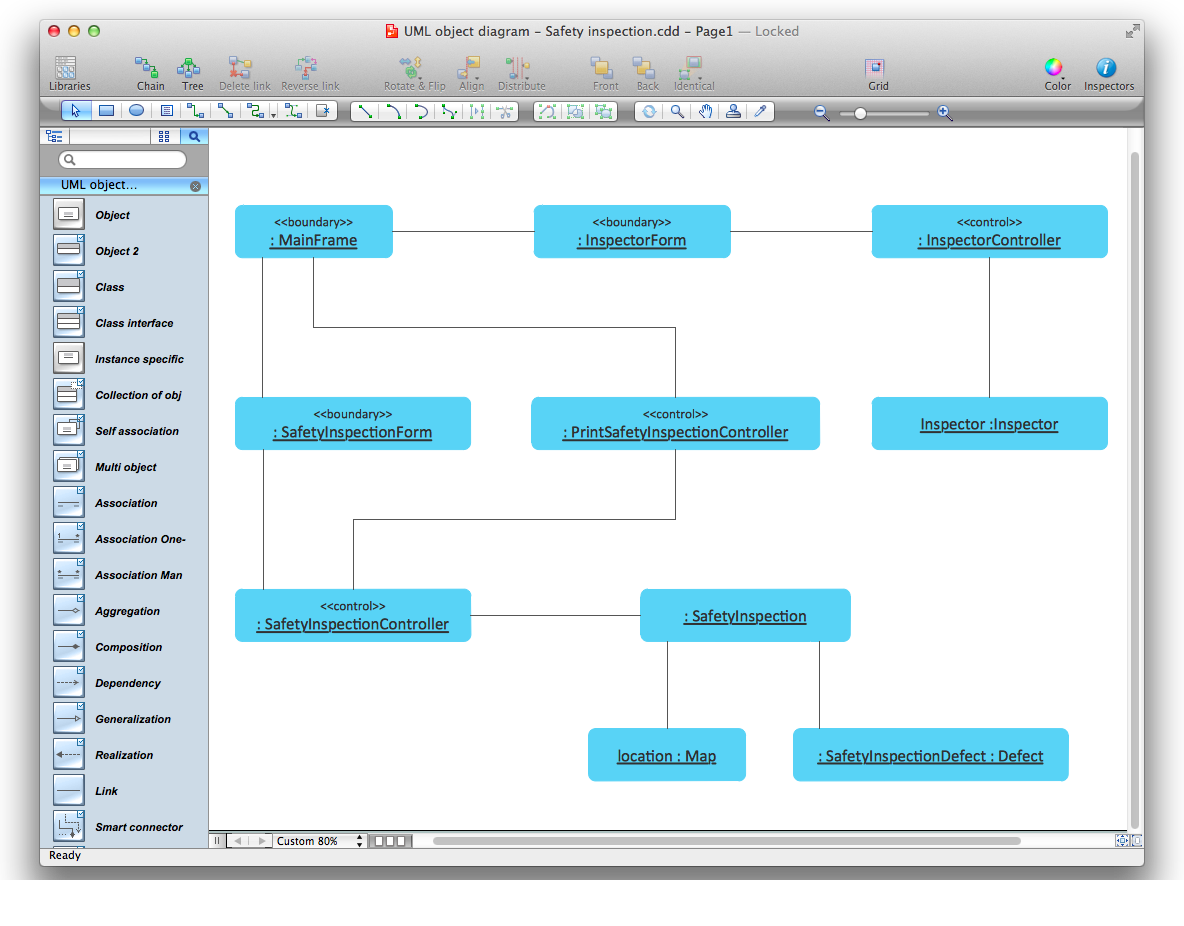
UML Object Diagram shows the structure of a modeled system at a specific time. ConceptDraw Rapid UML solution delivers libraries contain pre-designed objects fit UML notation, and ready to draw professional UML Object Diagram.
Chart Examples
Easy charting software comes with beautiful chart templates and examples. This makes it easy to create professional charts without prior experience.
 SWOT and TOWS Matrix Diagrams
SWOT and TOWS Matrix Diagrams solution extends ConceptDraw DIAGRAM and ConceptDraw MINDMAP software with features, templates, samples and libraries of vector stencils for drawing SWOT and TOWS analysis matrices and mind maps.
 Manufacturing and Maintenance
Manufacturing and maintenance solution extends ConceptDraw DIAGRAM software with illustration samples, templates and vector stencils libraries with clip art of packaging systems, industrial vehicles, tools, resources and energy.
Pyramid Chart Examples
Pyramid Charts and Triangle Diagrams are used to visually structure the topics and progressively order the quantitative data. They allow to illustrate hierarchical structure of the topics, proportional, interconnected and containment relations among the topics. The multilevel Pyramids and Triangle diagrams are constructed oriented up or down and divided into several horizontal slices. They are effectively used to represent marketing strategies, social strategies, information systems, market value, etc., to illustrate presentations, websites, documents, reports in business, finances, sales, management, marketing, media, training, consulting, and many other fields. To maximize the efficiency in drawing the Pyramid Charts, use the ConceptDraw DIAGRAM diagramming and vector drawing software extended with Pyramid Diagrams solution from Marketing area, which contains the set of Pyramid Chart examples, samples, templates and vector design elements of triangular diagrams and pyramids with different quantity of levels for various needs.How to create Cafe Floor Plan Design
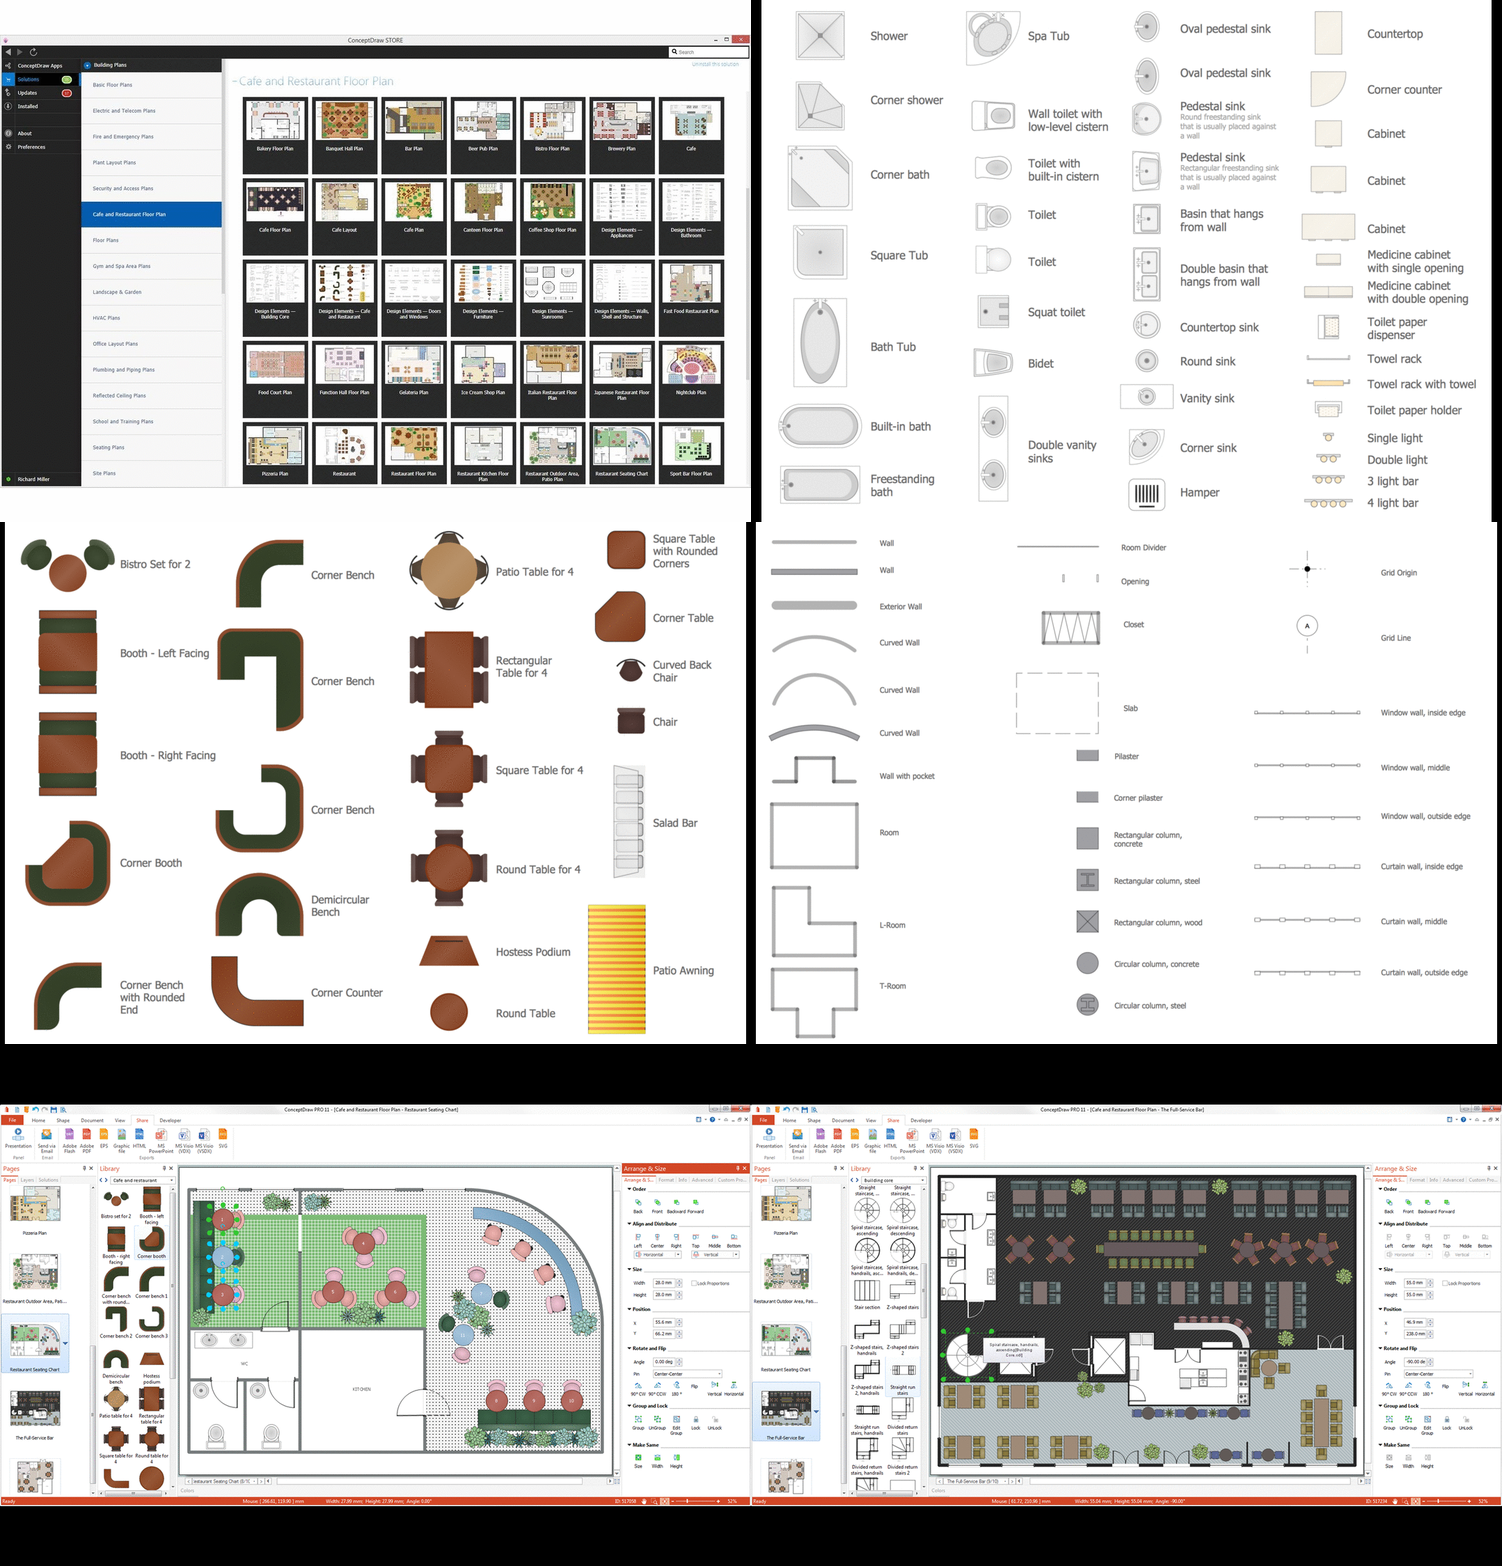
Cafes and restaurants are the premises, the main purpose of which is to organize the proper rest of persons. The basis for successful development of this business is the good mood of visitors that is formed under the influence of many factors including the pleasant design and interior of the cafe, its color solution, style, decoration elements, lighting, furniture, etc. That is why so many demands are presented to the style, design and decoration of the cafe, the main are originality, comfort and convenience of each guest. The cafe's interior design should be fully completed, every item and accessory should harmoniously supplement the overall interior picture. The competent approach and strict observance of all recommendations the specialists on planning and arrangement of cafe are very important, they guarantee the success of your institution. ConceptDraw DIAGRAM enhanced with powerful Cafe and Restaurant Floor Plan solution is easy-to-use cafe floor plan design software, which helps effectively develop Cafe designs, Cafe and Restaurant floor plans and layouts of any complexity.- Packaging, loading, customs - Vector stencils library | Manufacturing ...
- Energy Pyramid Diagram | Diagram of a Pyramid | Pyramid ...
- Mechanical Engineering | Design elements - Power sources ...
- Energy Pyramid Diagram | SWOT Template | Competitor Analysis ...
- Manufacturing and Maintenance | Manufacturing and Maintenance ...
- Design elements - Power sources | Manufacturing and Maintenance ...
- Target and Circular Diagrams | ConceptDraw Solution Park | Event ...
- Design elements - Resources and energy | Design elements ...
- Basic Flowchart Symbols and Meaning | Event-driven Process ...
- Resources and energy - Vector stencils library | Energy resources ...


