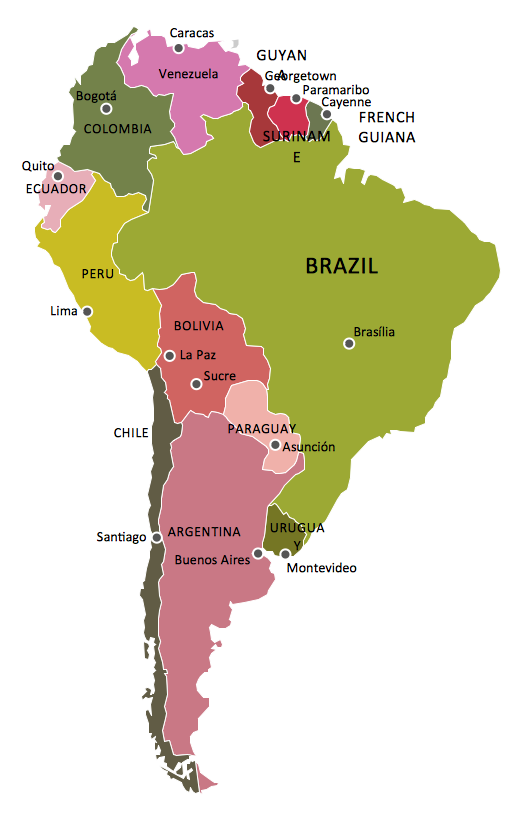
Geo Map — South America Continent
South America includes 12 sovereign states. ConceptDraw DIAGRAM is idea to draw the geological maps of South America continent from the pre-designed vector geo map shapes. Use Continent Maps solution from the Maps area of ConceptDraw Solution Park to draw thematic maps, geospatial infographics and vector illustrations for your business documents, presentations and websites.
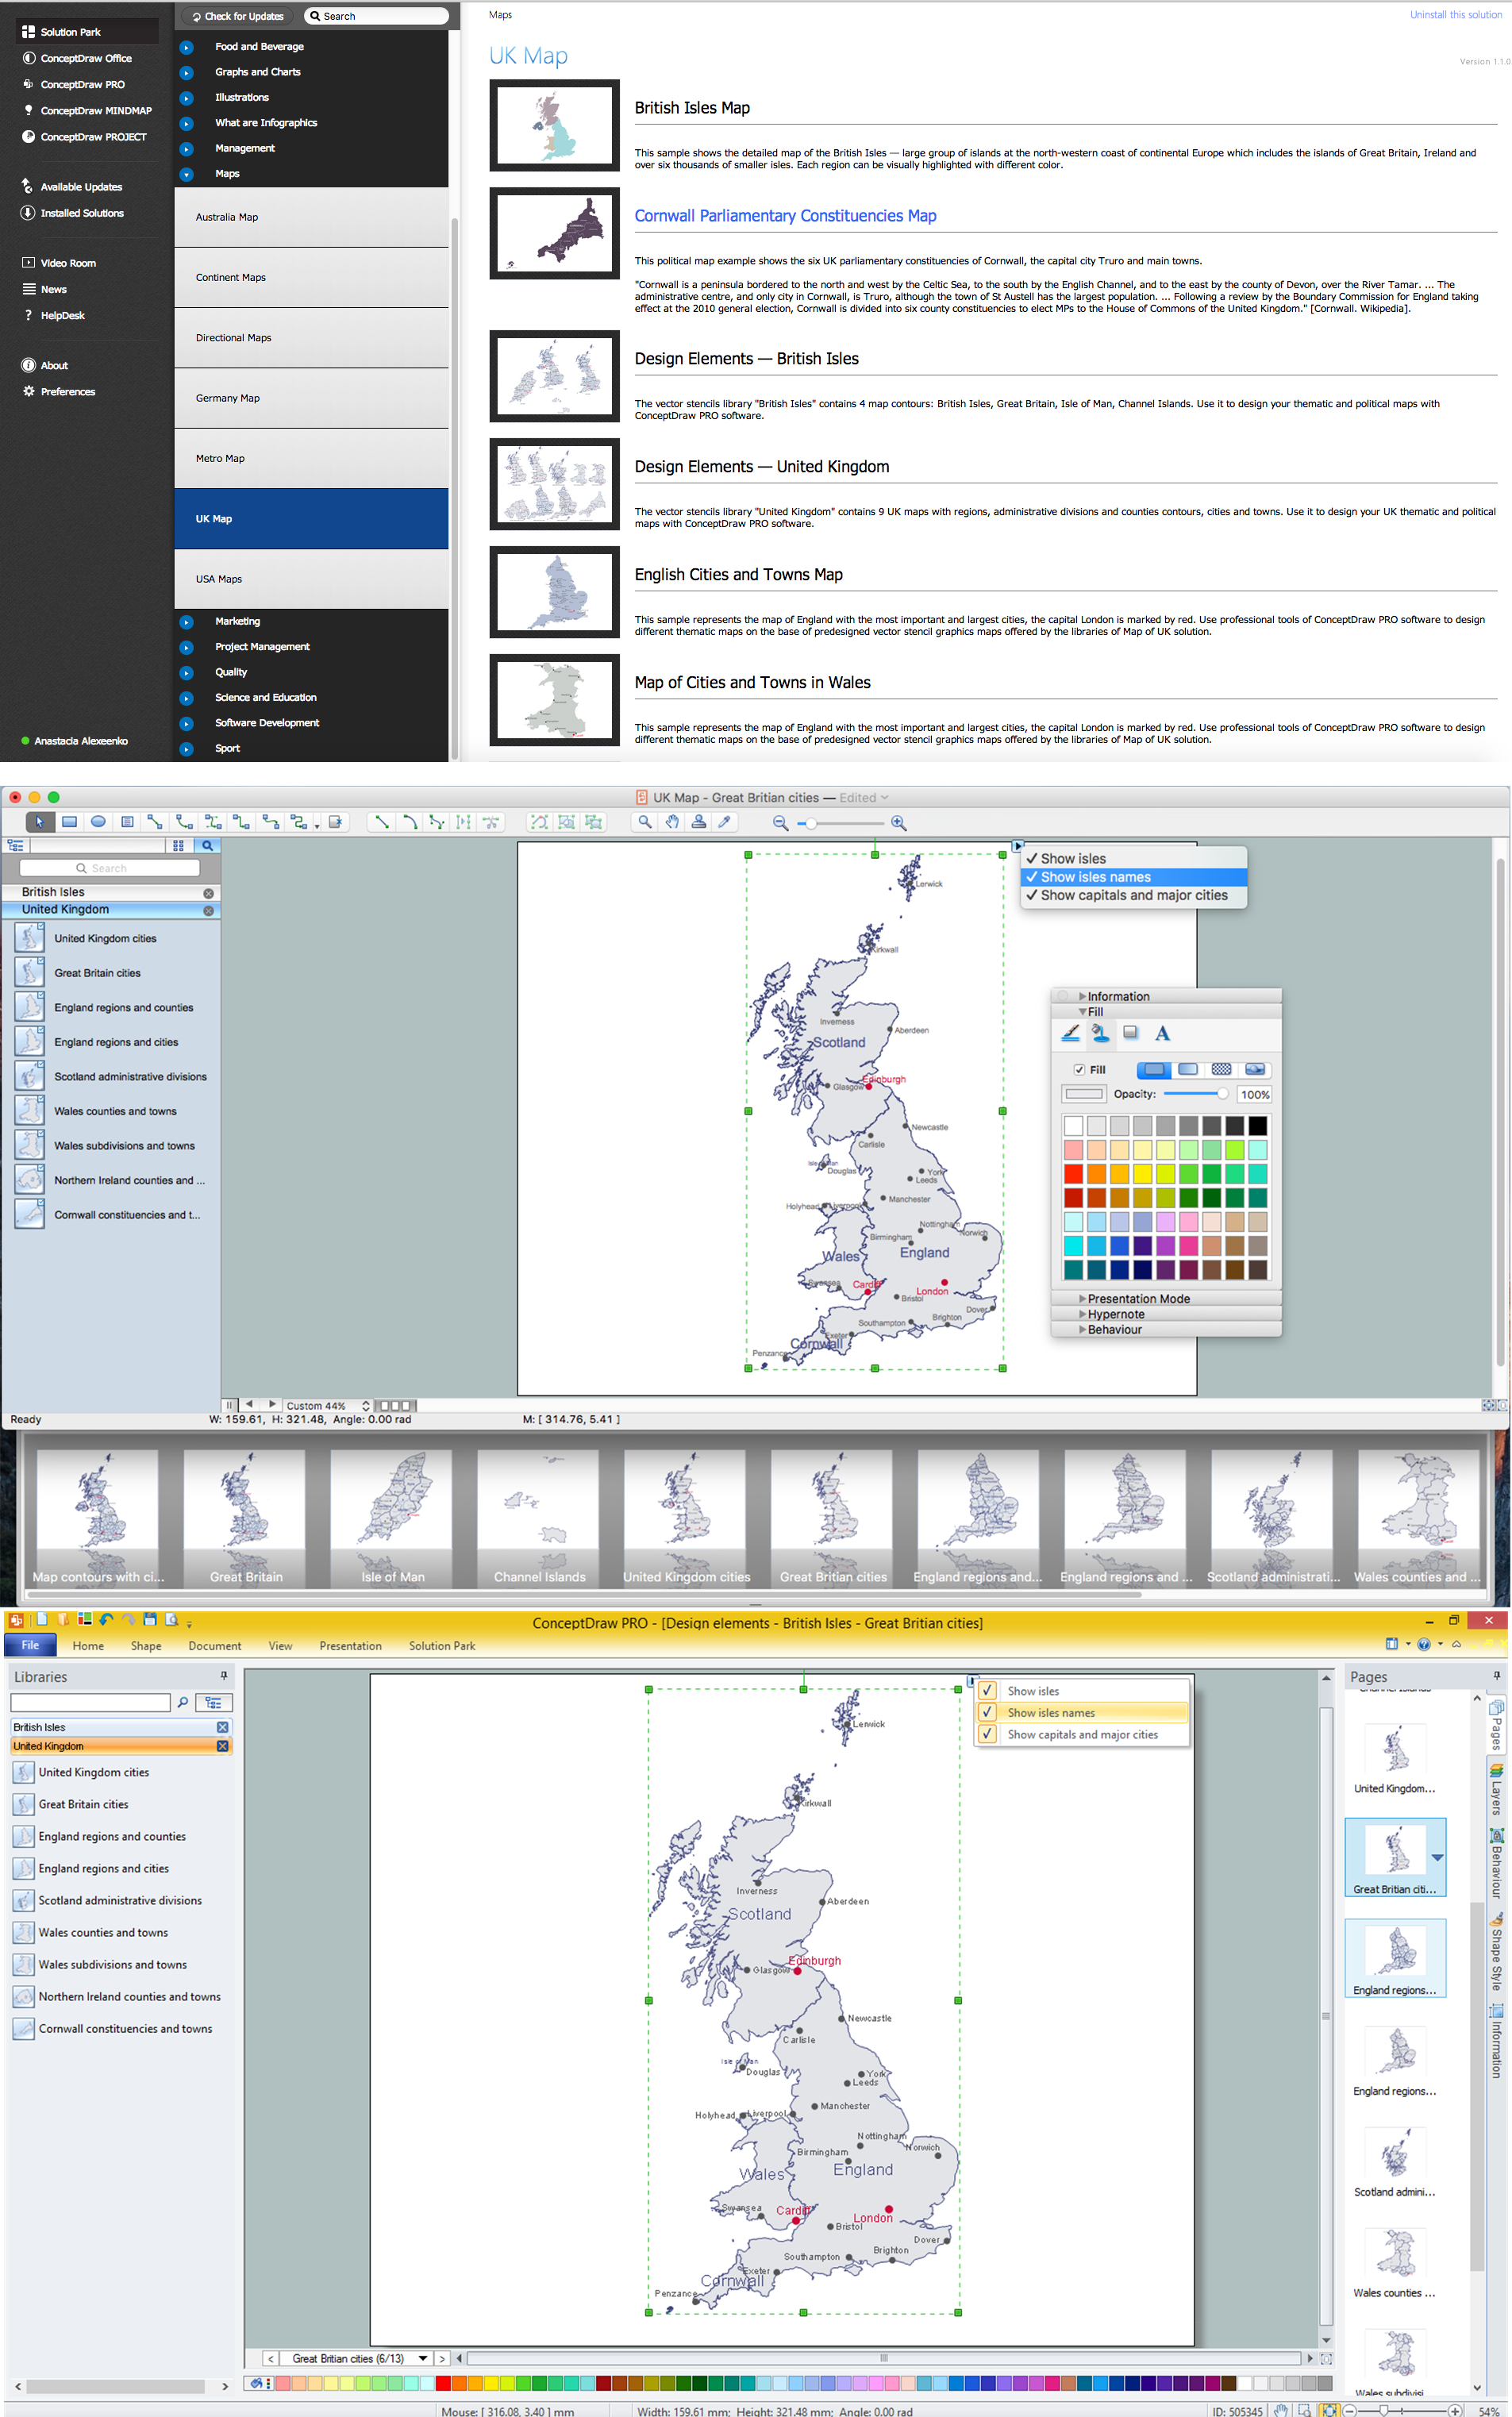
Map of UK — Great Britain Cities
Great Britain, also known as Britain, is an island in the North Atlantic off the north-west coast of continental Europe. With an area of 209,331 km2 (80,823 sq mi), it is the largest island in Europe and the ninth-largest in the world. How to design the Map of UK fast and easy? It is incredibly convenient to use special software. ConceptDraw DIAGRAM diagramming and vector drawing software offers the Map of UK Solution from the Maps Area of ConceptDraw Solution Park specially developed to make easier drawing the maps of UK counties, various UK related thematic maps and cartograms on their base.Geo Map - Asia - Papua New Guinea
Papua New Guinea, officially named the Independent State of Papua New Guinea, is a country in Oceania that occupies the eastern half of the island of New Guinea (the western portion of the island is a part of the Indonesian provinces of Papua and West Papua) and numerous offshore islands. The vector stencils library Papua New Guinea contains contours for ConceptDraw DIAGRAM diagramming and vector drawing software. This library is contained in the Continent Maps solution from Maps area of ConceptDraw Solution Park.Competitor Analysis
Competitor analysis is a first and obligatory step in elaboration the proper corporate marketing strategy and creating sustainable competitive advantage. Use powerful opportunities of numerous solutions from ConceptDraw Solution Park for designing illustrative diagrams, charts, matrices which are necessary for effective competitor analysis.Concept Map
A concept map is a way of representing relationships between ideas, images, or words. How to draw a Concept Map quick, easy and effective? ConceptDraw DIAGRAM offers the unique Concept Maps Solution from the "Diagrams" Area that will help you!UML Diagram Types List
Two types of diagrams are used in UML: Structure Diagrams and Behavior Diagrams. Behavior Diagrams represent the processes proceeding in a modeled environment. Structure Diagrams represent the elements that compose the system.Structured Systems Analysis and Design Method. SSADM with ConceptDraw DIAGRAM
Structured Systems Analysis and Design Method (abbr. SSADM) is a method developed in Great Britain and accepted in 1993 as a national standard for information systems development and analysis. SSADM is based on Data Flow Diagrams and is characterized with presence of clear sequence of steps at projecting, analysis, and documenting of information system. It involves 6 main stages: analysis of existing system or estimation of practicability, requirements definition, determination of technical requirements and equipment cost, development of logical data model, projecting of logical requirements and specification them, physical projecting. Each of them is also divided into several steps defining the tasks that should be fulfilled at a given stage. The most important SSADM elements are flows modeling with help of DFD, data logic modeling with help of LDS (Logical Data Structure) and description of entities behavior. Applying of SSADM is easy with ConceptDraw DIAGRAM diagramming and vector drawing software and Data Flow Diagram solution.
Business Package for Management
Package intended for professional who designing and documenting business processes, preparing business reports, plan projects and manage projects, manage organizational changes, prepare operational instructions, supervising specific department of an organization, workout customer service processes and prepare trainings for customer service personal, carry out a variety of duties to organize business workflow.
UML Notation
Unified Modeling Language (UML) is an open standard, the language of graphic description used for modeling objects in a field of software development and software engineering. It was created for definition, specification, visualization, designing and documenting software systems, as a unification of three object-oriented technologies Booch, OMT and OOSE, and uses the defined graphic notation for creating the visual models of object-oriented software systems. Description of UML consists of two parts, interactive and supplementing each other: UML semantics, which represents a certain metamodel, defines the abstract syntax and semantics of terms of object modeling with UML, and UML notation that is a graphic notation for visual representation of UML semantics. The powerful tools of the Rapid UML solution included to ConceptDraw Solution Park make the ConceptDraw DIAGRAM diagramming and vector drawing software the best for easy applying the UML notation when creating the visual models of object-oriented software systems and designing different kinds of UML diagrams.- Design elements - Management map Australia | Design elements ...
- Design elements - 3D directional maps | Process Flowchart | Basic ...
- State The Four Major Steps In Plotting Chart
- Geo Map - Oceania | Design elements - CRM maps | Types of Map ...
- How To use House Electrical Plan Software | Process Flowchart ...
- Elements location of a welding symbol | Elements location of a ...
- Emergency Plan | 7 Continents Map | Map of Germany | Example Of ...
- State Machine Diagram Showing Various Status Of A Laptop
- Wide area network (WAN) topology. Computer and Network Examples
- Geo Map - Canada - Prince Edward Island | Geo Map - Canada ...