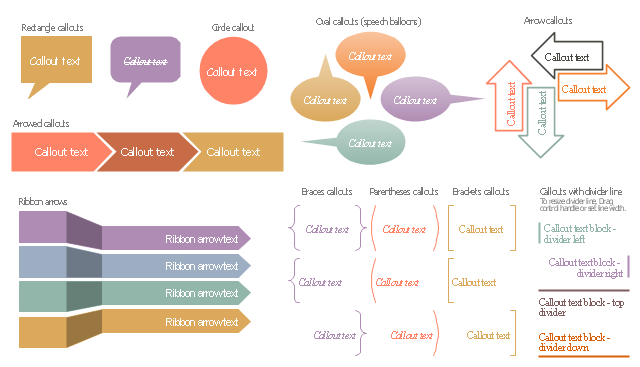
The vector stencils library "Callout blocks" contains 31 callouts, speech balloons and brackets for creating marketing infograms.
"In publishing, a call-out or callout is a short string of text connected by a line, arrow, or similar graphic to a feature of an illustration or technical drawing, and giving information about that feature. The term is also used to describe a short piece of text set in larger type than the rest of the page and intended to attract attention.
A similar device in word processing is a special text box with or without a small "tail" that can be pointed to different locations on a document." [Callout. Wikipedia]
The shapes example "Design elements - Callout blocks" was created using the ConceptDraw PRO diagramming and vector drawing software extended with the Marketing Infographics solition from the area "Business Infographics" in ConceptDraw Solution Park.
Basic Flowchart Symbols and Meaning
Flowcharts are the best for visually representation the business processes and the flow of a custom-order process through various departments within an organization. ConceptDraw PRO diagramming and vector drawing software extended with Flowcharts solution offers the full set of predesigned basic flowchart symbols which are gathered at two libraries: Flowchart and Flowcharts Rapid Draw. Among them are: process, terminator, decision, data, document, display, manual loop, and many other specific symbols. The meaning for each symbol offered by ConceptDraw gives the presentation about their proposed use in professional Flowcharts for business and technical processes, software algorithms, well-developed structures of web sites, Workflow diagrams, Process flow diagram and correlation in developing on-line instructional projects or business process system. Use of ready flow chart symbols in diagrams is incredibly useful - you need simply drag desired from the libraries to your document and arrange them in required order. There are a few serious alternatives to Visio for Mac, one of them is ConceptDraw PRO. It is one of the main contender with the most similar features and capabilities.
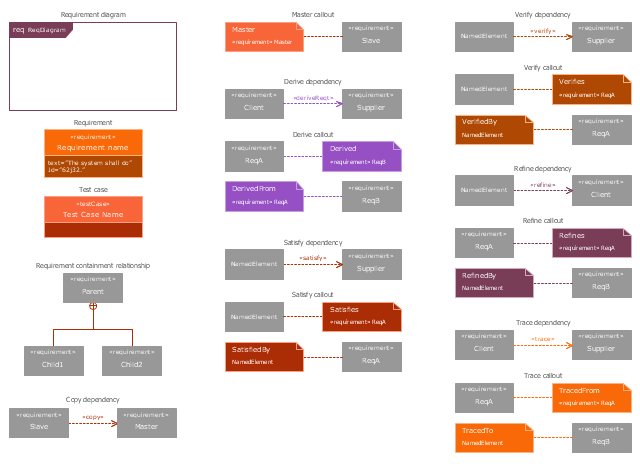
The vector stencils library "Requirement diagram" contains 21 SysML symbols.
Use it to design your requirement diagrams using ConceptDraw PRO diagramming and vector drawing software.
"A requirement specifies a capability or condition that must (or should) be satisfied. A requirement may specify a function that a system must perform or a performance condition a system must achieve. SysML provides modeling constructs to represent text-based requirements and relate them to other modeling elements. The requirements diagram described in this clause can depict the requirements in graphical, tabular, or tree structure format. A requirement can also appear on other diagrams to show its relationship to other modeling elements. The requirements modeling constructs are intended to provide a bridge between traditional requirements management tools and the other SysML models.
A requirement is defined as a stereotype of UML Class subject to a set of constraints. A standard requirement includes properties to specify its unique identifier and text requirement. Additional properties such as verification status, can be specified by the user.
Several requirements relationships are specified that enable the modeler to relate requirements to other requirements as well as to other model elements. These include relationships for defining a requirements hierarchy, deriving requirements, satisfying requirements, verifying requirements, and refining requirements." [www.omg.org/ spec/ SysML/ 1.3/ PDF]
The SysML shapes example "Design elements - Requirement diagram" is included in the SysML solution from the Software Development area of ConceptDraw Solution Park.
Make an Infographic
You want to make an infographic and need the useful and convenient drawing tools for this? In this case the ConceptDraw PRO software extended with Education Infographics Solution is a real godsend for you.
 Education Package
Education Package is a comprehensive set of multifarious graphical solutions from ConceptDraw Solution Park, collected together in help to ConceptDraw PRO users working in a field of science, education and training, which is aimed at improving the quality of education and helping to design with ease variety of interesting and colorful educational materials, diagrams, charts and maps. Use it to present the information and knowledge in an interesting, clear, structured and simple form to achieve a success in education and pedagogy, to maintain the interest of students and pupils throughout the whole learning process, at the lectures, lessons and even during independent work with additional materials, to contribute to better perception of scientific information by listeners during the conferences and reports.
Educational Technology Tools
What are the favorite educational technology tools and techniques for teachers? Of course these are pictures, images and education infographics! ConceptDraw PRO software supplied with Education Infographics Solution from the Business Infographics Area provides powerful drawing tools to help design the education infographics of any complexity.Education Information
The Education Information is multifariuos and can be often represented in various forms. Еру the most successful ways of presentation the information and data are various illustrations, diagrams and colorful education infographics which you can easily make in ConceptDraw PRO software extended with Education Infographics Solution from the Business Infographics Area.Symboles Organigramme
Les organigrammes sont parfaits pour représenter visuellement des processus operationnels. Par exemple, si vous avez besoin d'afficher le flux d'un processus d'ordre personnalisé par l'entremise de divers opérateurs au sein de votre organisation, vous pouvez utiliser un organigramme. Voir aussi d'autres symboles organigramme: Symboles ordinogramme standard, symboles du flux de travail, Vérification Les symboles du schéma fonctionnel, sOrganigramme comptables des symboles, Organigramme de vente des symboles, Symboles pour organigramme des RH, Carte des symboles de processus, Diagramme de processus opérationnels, Symboles utilisés dans le schéma IDEF0.The vector stencils library "Education pictograms" contains 128 education pictograms. Use this flat icon set to design your educational infogram in ConceptDraw PRO diagramming and vector drawing software.
The vector stencils library "Education pictograms" is included in the Education Infographics solution from the Business Infographics area of ConceptDraw Solution Park.
The vector stencils library "Education pictograms" is included in the Education Infographics solution from the Business Infographics area of ConceptDraw Solution Park.
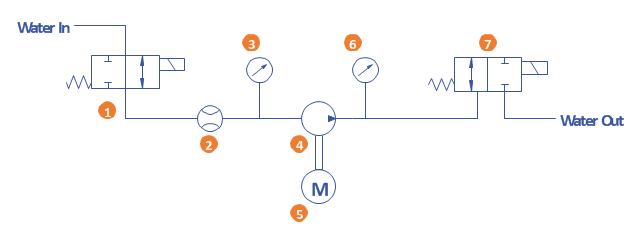
A simple hydraulic schematic showing apparatus for testing the strength of a hydraulic hose splice.
Water enters through normally closed solenoid valve (1) and passes through intake flow meter (2) to high pressure pump (4). Intake water pressure is monitored by pressure gauge (3). The hose to be tested connects between pump (4) and normally open solenoid activated drain valve (7). To test the hose, pump drive motor (5) is turned on, the solenoid of drain valve (7) is activated, closing the valve, and the pump is run to pressurize the hose. Test pressure is monitored by gauge (6). When the test is complete or the hose fails, the solenoid of drain valve (7) is deactivated, opening valve and discharging water, depressurizing the system. All components are operated electrically by a remote control circuit so that the operator may perform the test from a protected location, monitoring it with a camera and video monitor.
This hydraulic schematic example was redrawn using ConceptDraw PRO diagramming and vector drawing software from the Wikimedia Commons file: Hydraulic schematic.jpg.
[commons.wikimedia.org/ wiki/ File:Hydraulic_ schematic.jpg]
This file is licensed under the Creative Commons Attribution-Share Alike 3.0 Unported license.
[creativecommons.org/ licenses/ by-sa/ 3.0/ deed.en]
The hydraulic schematic example "Apparatus for testing the strength of a hydraulic hose splice" is included in the Mechanical Engineering solution from the Engineering area of ConceptDraw Solution Park.
 SYSML
SYSML
The SysML solution helps to present diagrams using Systems Modeling Language; a perfect tool for system engineering.
 Fishbone Diagrams
The Fishbone Diagrams solution extends ConceptDraw PRO v10 software with the ability to easily draw the Fishbone Diagrams (Ishikawa Diagrams) to clearly see the cause and effect analysis and also problem solving. The vector graphic diagrams produced using this solution can be used in whitepapers, presentations, datasheets, posters, and published technical material.
Model Based Systems Engineering
ConceptDraw PRO is a professional diagramming and vector drawing software. Now, enhanced with SysML Solution from the Software Development Area of ConceptDraw Solution Park, ConceptDraw PRO became an ideal software for model based systems engineering (MBSE).
 Process Flowcharts
This solution extends ConceptDraw PRO software with templates, samples, and library of vector shapes for drawing the Process Flowcharts.
- Design elements - Education titled callouts | Design elements ...
- Design elements - Education titled callouts | Design elements ...
- Design elements - Callout blocks | Design elements - Education ...
- Design elements - Callouts | Design elements - Education titled ...
- Callout Diagram
- Design elements - Education titled callouts | Design elements ...
- Design elements - Education titled callouts | Design elements ...
- Design elements - Bulleted and numbered lists | Design elements ...
- Flat Design Callout Png
- Star Callout Png
- Hydraulic circuits | Design elements - Hydraulic pumps and motors ...
- Flowchart design . Flowchart symbols, shapes, stencils and icons ...
- Design elements - Scrum people | Video and audio - Vector stencils ...
- Clipart School | CCTV Network Example | Design elements ...
- Flowchart design . Flowchart symbols, shapes, stencils and icons ...
- Pen Flat Design Png
- Bio Flowchart Lite | Bio Flowchart | Content Marketing Infographics ...
- Mechanical Drawing Symbols | Welding symbols | Interior Design ...
- Design elements - Cloud clipart | Presentation Clipart | Application ...
- Map symbols - Vector stencils library | Design elements - Subway ...
