This typography infographics example was redesigned from the Wikimedia Commons file: Sentido jerarquico de las normas.png. [commons.wikimedia.org/ wiki/ File:Sentido_ jerarquico_ de_ las_ normas.png]
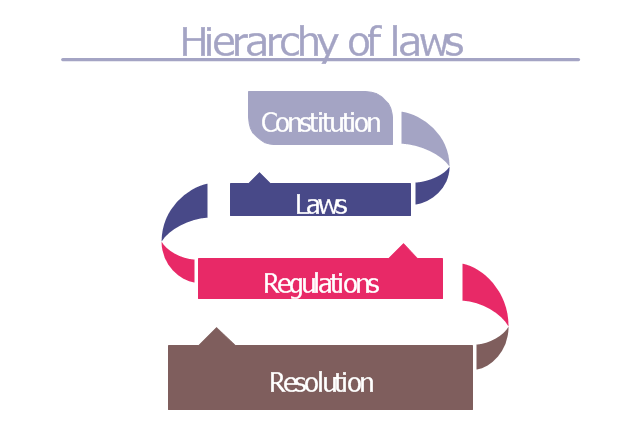
"Hierarchy of laws.
Article 1.2 of the Spanish Civil Code establishes that inferior and superior laws to be distinguished. However, the relationship between laws is not limited to a question of hierarchy, but also relationships of competency exist between some laws and others.
With effect to this, the Spanish Constitution of 1978 is the supreme law, which regulates all the complex relationships between the different laws and their place in the hierarchy.
The hierarchy of Spanish laws is thus:
(1) The Constitution.
(2) International treaties.
(3) The law in its strict sense: Organic Law (which requires an absolute majority from the Cortes Generales), ordinary law and regulatory laws (amongst which are found the Royal Decree of Law and the Legislative Royal Decree).
(4) Laws stemming from the executive, with its own hierarchy based on the function of the body that made them (Royal Decree, Decree, Ministerial Order, etc.)." [Law of Spain. Wikipedia]
The infographics example "Hierarchy of laws" was created using the ConceptDraw PRO diagramming and vector drawing software extended with the Typography Infographics solition from the area "What is infographics" in ConceptDraw Solution Park.
Infographics
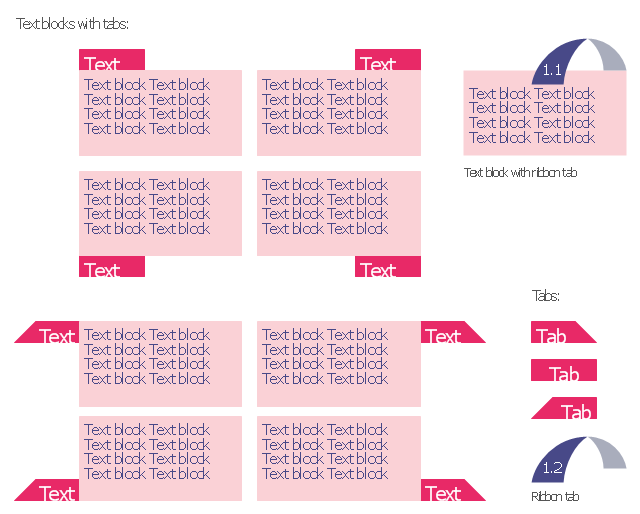
The vector stencils library "Tabbed text blocks" contains 13 tabs and tabbed text blocks. Use it to add typography elements into your infographics.
"In interface design, a tabbed document interface (TDI) or Tab is a graphical control element that allows multiple documents or panels to be contained within a single window, using tabs as a navigational widget for switching between sets of documents. It is an interface style most commonly associated with web browsers, web applications, text editors, and preference panes.
GUI tabs are modeled after traditional card tabs inserted in paper files or card indexes (in keeping with the desktop metaphor)." [Tab (GUI). Wikipedia]
The example "Tabbed text blocks" was created using the ConceptDraw PRO diagramming and vector drawing software extended with the Typography Infographics solition from the area "What is infographics" in ConceptDraw Solution Park.
Typography infographics elements - Tabbed text blocks
The vector stencils library "Ribbon interface" contains 41 ribbon shapes.
Use it for designing Microsoft ribbon graphic user interface (GUI) of software for Windows computers in the ConceptDraw PRO diagramming and vector drawing software extended with the Graphic User Interface solution from the Software Development area of ConceptDraw Solution Park.
Use it for designing Microsoft ribbon graphic user interface (GUI) of software for Windows computers in the ConceptDraw PRO diagramming and vector drawing software extended with the Graphic User Interface solution from the Software Development area of ConceptDraw Solution Park.
Main Window with Menu
Main Window
Menu
Special Menu
Field

Tools Group
Tools Group Minimized
Tool Button

Tool Button

Toolbar
Label
Text Label

Edit Box
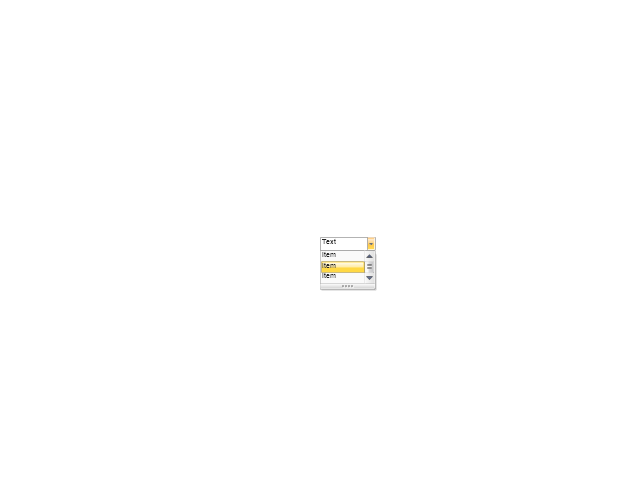
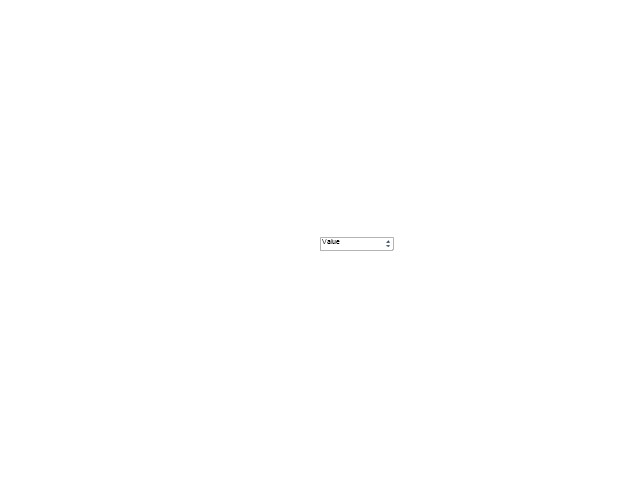
Combobox
Combobox with List
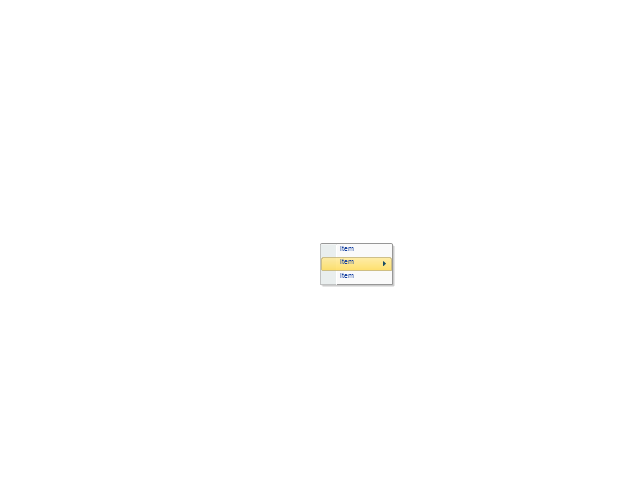
Drop-down Menu
Spin Box
Check Box

Radio Button

Styles Control 1

Styles Control 2

Rounded Tab

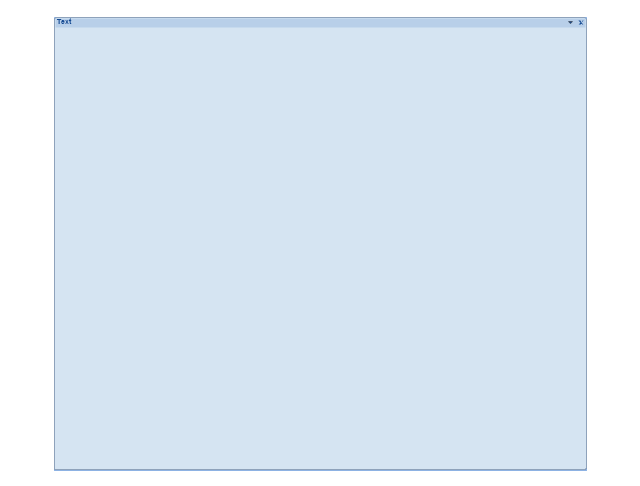
Floating Dialogue
Status Bar

Small Toolbar (for Status Bar)
-ribbon-interface---vector-stencils-library.png--diagram-flowchart-example.png)
Zoom Slider

Horizontal Scroll
Vertical Scroll
Drop-down List

Arrow
Close

Drop-down Menu Base

Drop-down Menu Left Part

Menu/List Item (Text)
-ribbon-interface---vector-stencils-library.png--diagram-flowchart-example.png)
Menu/List Item (Image)
-ribbon-interface---vector-stencils-library.png--diagram-flowchart-example.png)
Menu/List Item (Image with Text)
-ribbon-interface---vector-stencils-library.png--diagram-flowchart-example.png)
Meny/List Header

Drop-down Menu Separator

Vertical Separator

Chek/Option for Drop-down Menu

Image

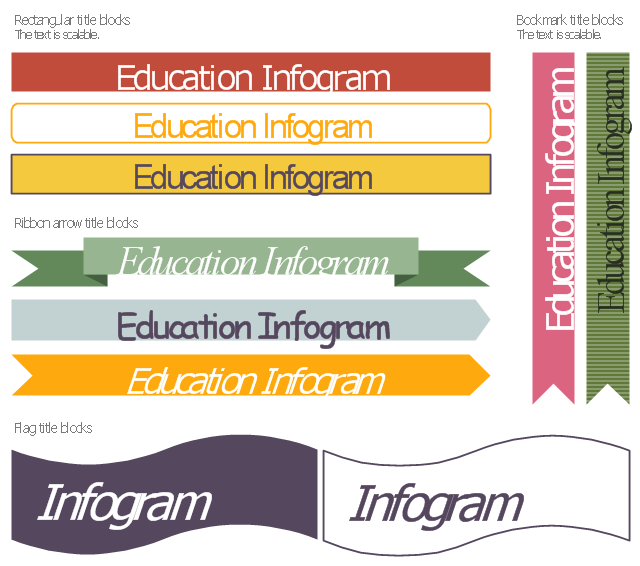
The vector stencils library "Education title blocks" contains 10 title block shapes: rectangular, arrow, ribbon, bookmark, flag.
Use these elements to design your educational infograms.
"The title of a book, or any other published text or work of art, is a name for the work which is usually chosen by the author. A title can be used to identify the work, to place it in context, to convey a minimal summary of its contents, and to pique the reader's curiosity." [Title (publishing). Wikipedia]
The shapes example "Design elements - Education title blocks" was created using the ConceptDraw PRO diagramming and vector drawing software extended with the Education Infographics solition from the area "Business Infographics" in ConceptDraw Solution Park.
Titles
This ecology infographic example was created on the base of the infographics "Greenhouse gas emissions in the EU" from the Debating Europe website. [debatingeurope.eu/ wp-content/ uploads/ 2013/ 06/ TH_ 2_ social.png]
"A greenhouse gas (sometimes abbreviated GHG) is a gas in an atmosphere that absorbs and emits radiation within the thermal infrared range. This process is the fundamental cause of the greenhouse effect. The primary greenhouse gases in the Earth's atmosphere are water vapor, carbon dioxide, methane, nitrous oxide, and ozone. Greenhouse gases greatly affect the temperature of the Earth; without them, Earth's surface would average about 33 °C colder, which is about 59 °F below the present average of 14 °C (57 °F)." [Greenhouse gas. Wikipedia]
The ecology infographic example "EU greenhouse gas emissions" was created using the ConceptDraw PRO diagramming and vector drawing software extended with the Management Infographics solition from the area "Business Infographics" in ConceptDraw Solution Park.
Ecology infographics example

Used Solutions
This healthcare economics infogram example was redesigned from the Wikimedia Commons file: Medicare spending per capita.png.
"Research by The Dartmouth Institute for Health Policy and Clinical Practice in the Dartmouth Atlas showed that in 2006, Medicare spending varied significantly by state. Other research quoted by the CEA Report indicated that up to 30% of Medicare costs could be saved if the middle- and high-cost states spent at the level of the lower-cost states.[1] Bear in mind that this is a Medicare comparison, so all the persons in the population analyzed are over 65.
References:
1. White House Council of Economic Advisors (CEA)-The Economic Case for Health Care Reform-June 2009-Page 19."
[commons.wikimedia.org/ wiki/ File:Medicare_ spending_ per_ capita.png]
The healthcare management thematic map sample "U.S. Medicare spending per capita" was created using the ConceptDraw PRO diagramming and vector drawing software extended with the Management Infographics solition from the area "Business Infographics" in ConceptDraw Solution Park.
Healthcare management infographics example

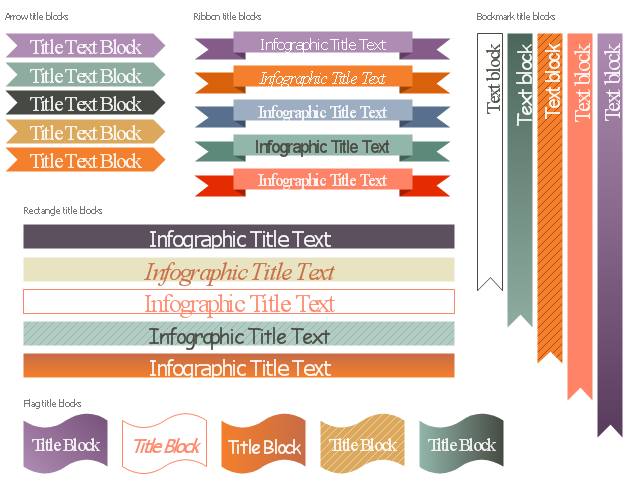
The vector stencils library "Title blocks" contains title and bookmark text blocks for creating marketing infograms.
"The title of a book, or any other published text or work of art, is a name for the work which is usually chosen by the author. A title can be used to identify the work, to place it in context, to convey a minimal summary of its contents, and to pique the reader's curiosity.
Some works supplement the title with a subtitle. Texts without separate titles may be referred to by their incipit, especially those produced before the practice of titling became popular. During development, a work may be referred to by a temporary working title. A piece of legislation may have both a short title and a long title. In library cataloging, a uniform title is assigned to a work whose title is ambiguous.In book design, the title is typically shown on the spine, the front cover, and the title page." [Title (publishing). Wikipedia]
The shapes example "Design elements - Title blocks" was created using the ConceptDraw PRO diagramming and vector drawing software extended with the Marketing Infographics solition from the area "Business Infographics" in ConceptDraw Solution Park.
Titles and bookmarks
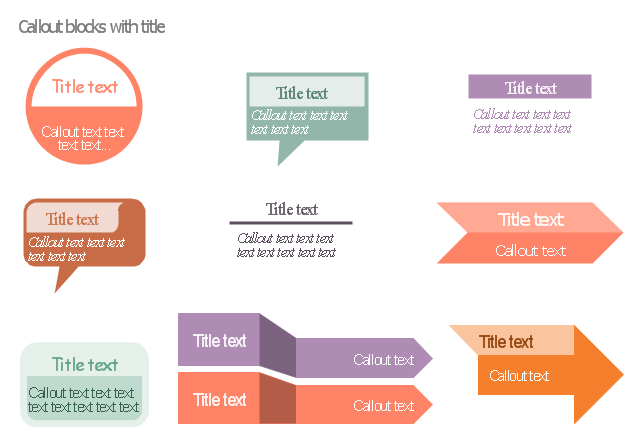
The vector stencils library "Titled callouts" contains 10 callout blocks with title and text.
Use it to design your marketing infograms.
The shapes example "Design elements - Titled callouts" was created using the ConceptDraw PRO diagramming and vector drawing software extended with the Marketing Infographics solition from the area "Business Infographics" in ConceptDraw Solution Park.
Use it to design your marketing infograms.
The shapes example "Design elements - Titled callouts" was created using the ConceptDraw PRO diagramming and vector drawing software extended with the Marketing Infographics solition from the area "Business Infographics" in ConceptDraw Solution Park.
Callout blocks with title and text
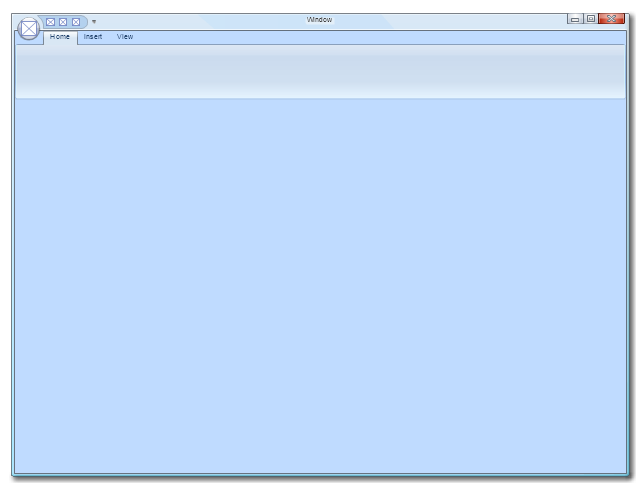
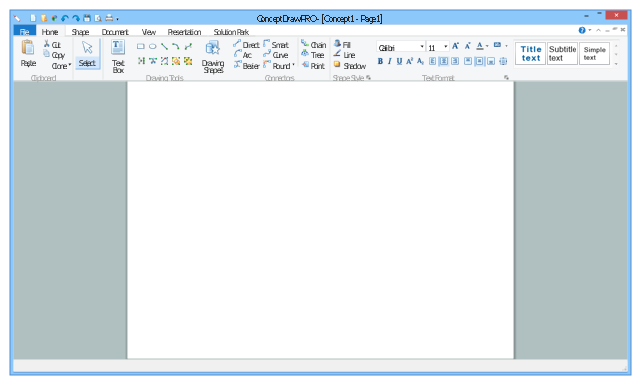
This example shows usage of design elements in the graphic user interface (GUI) of Windows 8 application Ribbon view.
"The Windows Ribbon framework is a rich command presentation system that provides a modern alternative to the layered menus, toolbars, and task panes of traditional Windows applications. ...
The UI of the Ribbon View is the primary feature of the Ribbon framework and provides the next-generation user experience for presenting commands in Windows applications.
The ribbon is a command bar that exposes the major features of an application through a series of tabs at the top of an application window." [msdn.microsoft.com/ en-us/ library/ windows/ desktop/ dd316910%28v=vs.85%29.aspx]
The sample "Ribbon view" was created using the ConceptDraw PRO diagramming and vector drawing software extended with the Windows 8 User Interface solution from the Software Development area of ConceptDraw Solution Park.
Application window
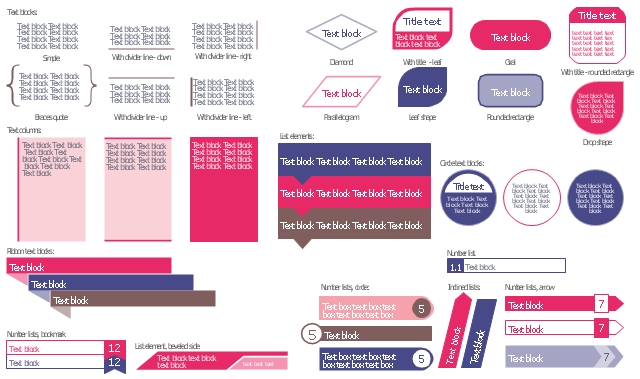
The vector stencils library "Text blocks" contains 38 text blocks including braces quote, blocks with divider line, text columns, list and numbered list elements, inclined list elements, blocks, different shape blocks (arrow, ribbon, circle, rounded rectangle, oval, diamond, parallelogram, leaf, drop), titled text blocks. Use it to add typography elements into your infographics.
The example "Text blocks" was created using the ConceptDraw PRO diagramming and vector drawing software extended with the Typography Infographics solition from the area "What is infographics" in ConceptDraw Solution Park.
The example "Text blocks" was created using the ConceptDraw PRO diagramming and vector drawing software extended with the Typography Infographics solition from the area "What is infographics" in ConceptDraw Solution Park.
Typography infographics elements - Text blocks
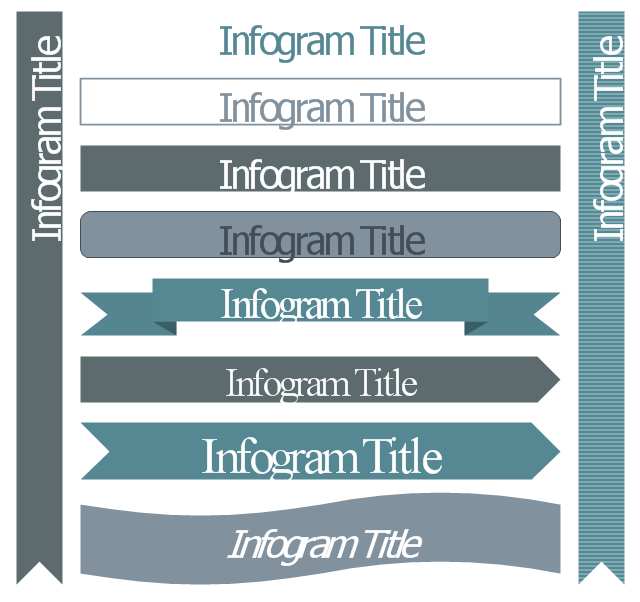
The vector stencils library "Management title blocks" contains 10 shapes: rectangle, rounded rectangle, ribbon, arrow, flag, bookmark.
Use it to design your management infogram.
The titles example "Design elements - Management title blocks" was created using the ConceptDraw PRO diagramming and vector drawing software extended with the Management Infographics solition from the area "Business Infographics" in ConceptDraw Solution Park.
Infographic titles
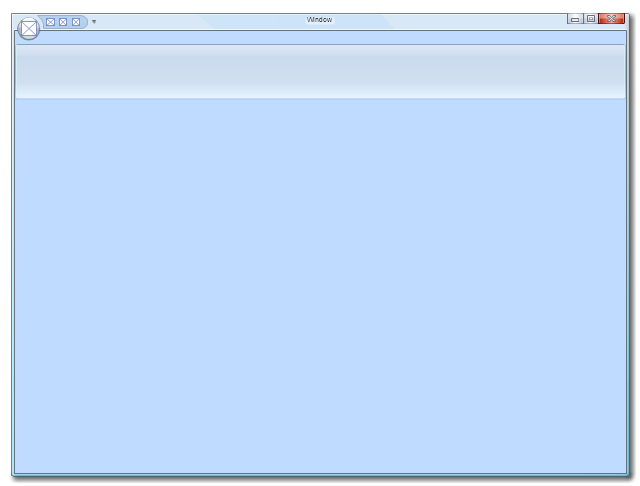
This example shows usage of design elements in the graphic user interface (GUI) of Windows 8 application Ribbon view.
"The Windows Ribbon framework is a rich command presentation system that provides a modern alternative to the layered menus, toolbars, and task panes of traditional Windows applications. ...
The UI of the Ribbon View is the primary feature of the Ribbon framework and provides the next-generation user experience for presenting commands in Windows applications.
The ribbon is a command bar that exposes the major features of an application through a series of tabs at the top of an application window." [msdn.microsoft.com/ en-us/ library/ windows/ desktop/ dd316910%28v=vs.85%29.aspx]
The sample "Ribbon view" was created using the ConceptDraw PRO diagramming and vector drawing software extended with the Windows 8 User Interface solution from the Software Development area of ConceptDraw Solution Park.
"The Windows Ribbon framework is a rich command presentation system that provides a modern alternative to the layered menus, toolbars, and task panes of traditional Windows applications. ...
The UI of the Ribbon View is the primary feature of the Ribbon framework and provides the next-generation user experience for presenting commands in Windows applications.
The ribbon is a command bar that exposes the major features of an application through a series of tabs at the top of an application window." [msdn.microsoft.com/ en-us/ library/ windows/ desktop/ dd316910%28v=vs.85%29.aspx]
The sample "Ribbon view" was created using the ConceptDraw PRO diagramming and vector drawing software extended with the Windows 8 User Interface solution from the Software Development area of ConceptDraw Solution Park.
Application window
This infographic template consist of Europe map contours, bar chart, title blocks, text blocks and callouts.
Use it to design your management infograms using the ConceptDraw PRO diagramming and vector drawing software.
The template "EU management infogram" is included in the Management infographics solution from the Business infographics area of ConceptDraw Solution Park.
Use it to design your management infograms using the ConceptDraw PRO diagramming and vector drawing software.
The template "EU management infogram" is included in the Management infographics solution from the Business infographics area of ConceptDraw Solution Park.
EU management infogram template
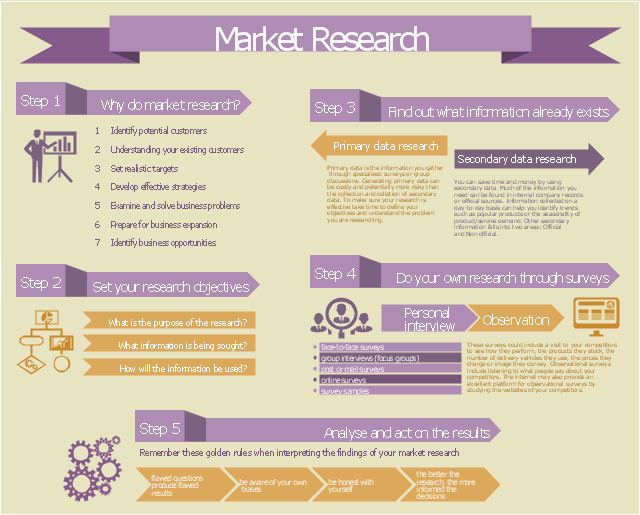
This example of marketing infogram was created on the base of web page "Market research" from the website of West Australian State Government agency Small Business Development Corporation (SBDC).
"Market research is a key part of developing your marketing strategy. It’s about collecting information to give you an insight into your customers’ mind so that you understand what they want, how they gather information and where they come from. You can also do market research to get a better idea of market trends and what is happening in your industry sector.
The information you gather and analyse builds the foundation of good business decisions whether it’s deciding what product or service you’ll offer, where your business should be located, how to distribute your products or how you communicate with consumers." [smallbusiness.wa.gov.au/ market-research]
The example "Marketing Infographics - Market Research" was created using the ConceptDraw PRO diagramming and vector drawing software extended with the Marketing Infographics solition from the area "Business Infographics" in ConceptDraw Solution Park.
Marketing infogram
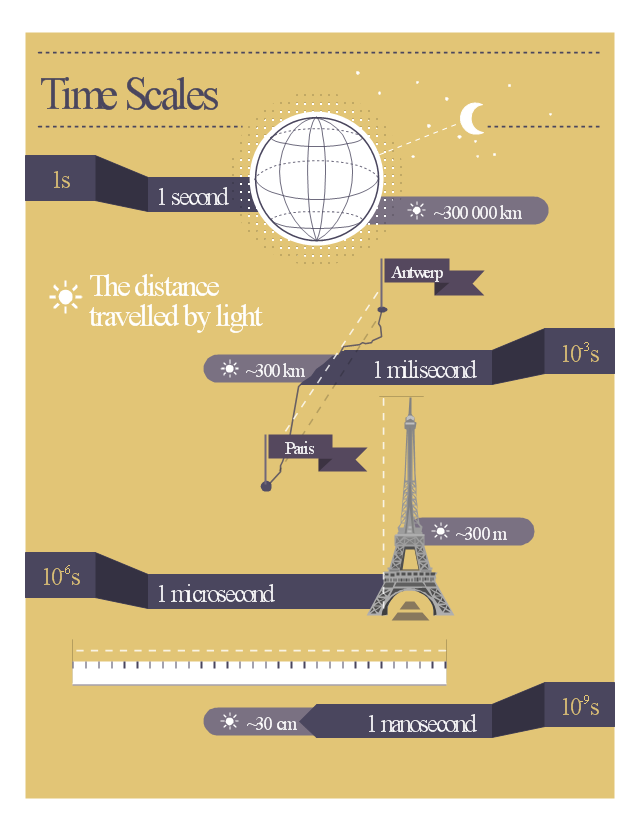
"Light-travel distance.
This distance is the time (in years) that it took light to reach the observer from the object multiplied by the speed of light. For instance, the radius of the observable Universe in this distance measure becomes the age of the Universe multiplied by the speed of light (1 light year/ year) i.e. 13.8 billion light years. Also see misconceptions about the size of the visible universe." [Distance measures (cosmology). Wikipedia]
The educational infogram "Time scales" was created using the ConceptDraw PRO diagramming and vector drawing software extended with the Education Infographics solition from the area "Business Infographics" in ConceptDraw Solution Park.
Educational infogram
- Rectangular Ribbon Png
- Ribbon Png
- Ribbon Design Png
- Title Ribbon Png
- Shapes Ribbon Png
- Blue Ribbon Png
- Text Box Design Png
- Text All Png
- Design For Title Png
- Ribbon Vector Png
- Ribbons Vector Png
- Title Box Vector Png
- Microsoft Windows ribbon interface hints | Ribbon interface - Vector ...
- Radiation Png
- Hierarchy of laws | Typography Art | Pyramid Diagram | Png ...
- Ribbon Vectors In Png
- Ribbon interface - Vector stencils library | Design elements - Tabbed ...
- Group Interaction Vector Png
- Titials Text Designing
- Rounded Arrow Png