 Organizational Charts
Organizational Charts solution extends ConceptDraw PRO software with samples, templates and library of vector stencils for drawing the org charts.
HelpDesk
Event-driven Process Chain (EPC) Diagram Software
An EPC diagram is a type of flowchart used in business process analysis. It shows different business processes through various work flows. The workflows are shown as processes and events that are related to different executes and tasks that allow business workflow to be completed. An EPC diagram shows different business processes through various workflows. The workflows are seen as functions and events that are connected by different teams or people, as well as tasks that allow business processes to be executed. The best thing about this type of enterprise modelling is that creating an EPC diagram is quick and simple as long as you have the proper tool. One of the main usages of the EPC diagrams is in the modelling, analyzing and re-engineering of business processes. With the use of the flowchart, businesses are able to see inefficiencies in the processes and modify to make them more productive. Event-driven process chain diagrams are also used to configure an enterprise resource pla"Organizational behavior is a field of study that investigates the impact that individuals, groups and structures have on behavior within an organization for the purpose of applying such knowledge towards improving an organization's effectiveness. It is an interdisciplinary field that includes sociology, psychology, communication, and management; and it complements the academic studies of organizational theory (which is focused on organizational and intra-organizational topics) and human resource studies (which is more applied and business-oriented). It may also be referred to as organizational studies or organizational science." [Organizational behavior. Wikipedia]
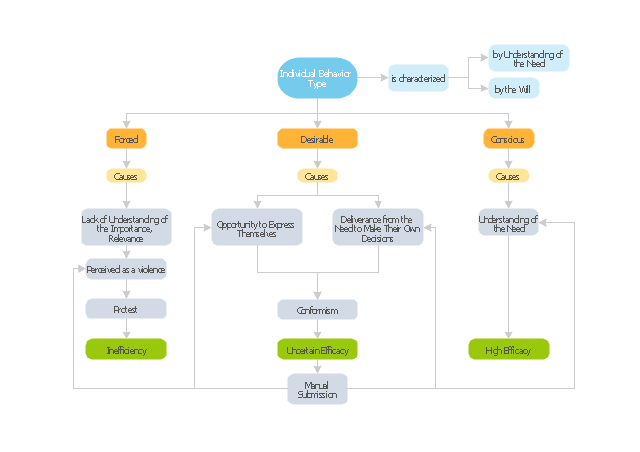
The block diagram example "Types of individual behavior in organization" was created using the ConceptDraw PRO diagramming and vector drawing software extended with the Block Diagrams solution from the area "What is a Diagram" of ConceptDraw Solution Park.
The block diagram example "Types of individual behavior in organization" was created using the ConceptDraw PRO diagramming and vector drawing software extended with the Block Diagrams solution from the area "What is a Diagram" of ConceptDraw Solution Park.
- How to Draw an Organization Chart | Organizational Structure ...
- Matrix Organization Structure | Competitor Analysis | Cloud ...
- Organizational Structure | How to Draw an Organization Chart ...
- 4 Level pyramid model diagram - Information systems types | 5 Level ...
- Marketing Charts | Process Flowchart | Marketing Organization Chart ...
- The Diagram Describe The Organization Hierarchy Of A Software
- How to Draw an Organization Chart | Examples of Flowcharts, Org ...
- Organizational Structure | Organizational Structure | Matrix ...
- Draw The Diagram Of Types Of Organizations Structures
- Diagram Of Types Of Organizational Structure
- The Diagram Of An Organisation Chart Of A School
- How to Use the ″Online Store PR Campaign″ Sample | Bar ...
- Marketing Diagrams
- How to Draw an Organization Chart | Organization Chart Templates ...
- Organization Chart For Online Shopping
- TQM Diagram Example | Definition TQM Diagram | TQM Software ...
- Pyramid Chart Examples | Pyramid Diagram | Organizational Charts ...
- Organizational Structure | Active Directory Domain Services diagram ...
- Organizational Diagram Software Of Banking
- Pyramid Diagram | Organizational Structure | How to Draw an ...

