Line Graph Charting Software

 ConceptDraw Solution Park
ConceptDraw Solution Park collects graphic extensions, examples and learning materials
Chart Examples

 Picture Graphs
Typically, a Picture Graph has very broad usage. They many times used successfully in marketing, management, and manufacturing. The Picture Graphs Solution extends the capabilities of ConceptDraw PRO v10 with templates, samples, and a library of professionally developed vector stencils for designing Picture Graphs.
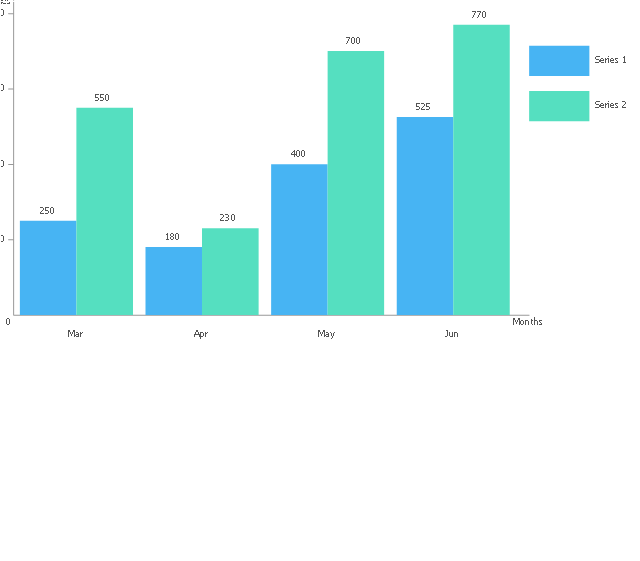
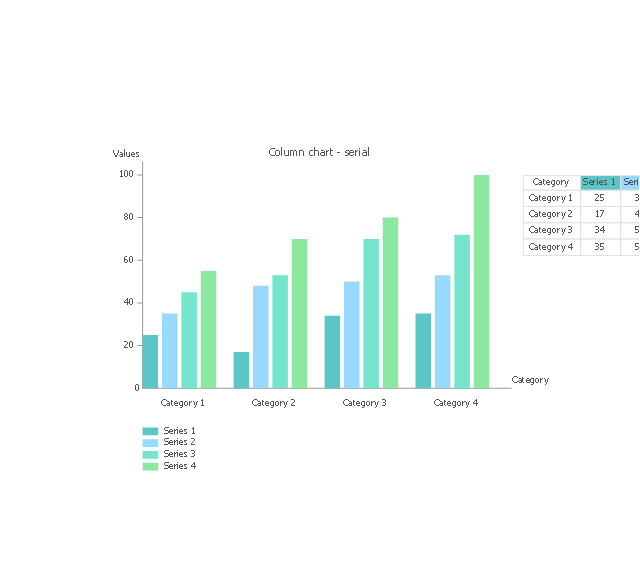
The vector stencils library "Bar charts" contains 6 templates of bar and column charts for visualizing quantitative and statistical data comparison and changes in time series. Use these shapes to draw your bar graphs in the ConceptDraw PRO diagramming and vector drawing software extended with the Bar Graphs solution from the Graphs and Charts area of ConceptDraw Solution Park.
Vertical bar chart

Horizontal bar chart

Double bar chart
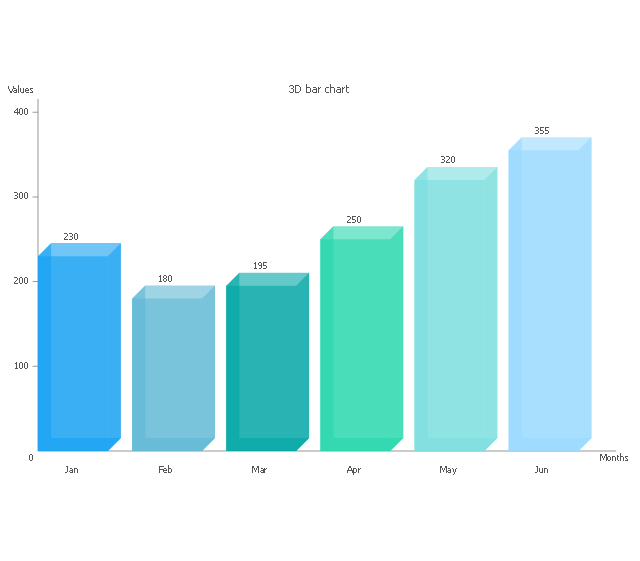
3D bar chart
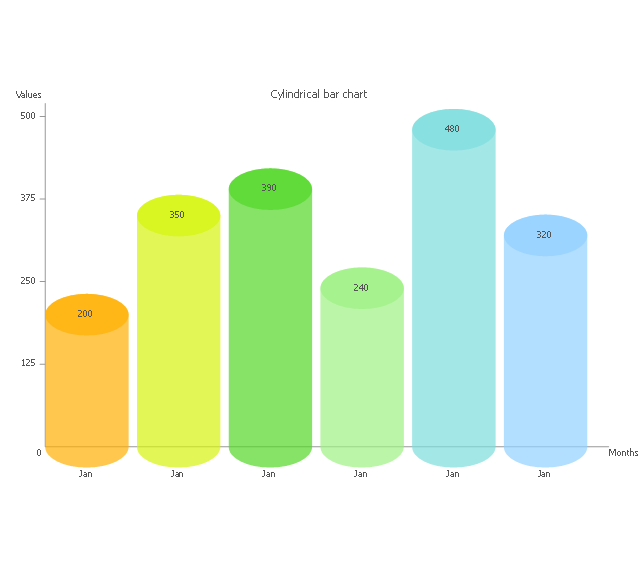
Cylindrical bar chart
Coordinate system 3D
 Bar Graphs
The Bar Graphs solution enhances ConceptDraw PRO v10 functionality with templates, numerous professional-looking samples, and a library of vector stencils for drawing different types of Bar Graphs, such as Simple Bar Graph, Double Bar Graph, Divided Bar Graph, Horizontal Bar Graph, Vertical Bar Graph, and Column Bar Chart.
 Line Graphs
How to draw a Line Graph with ease? The Line Graphs solution extends the capabilities of ConceptDraw PRO v10 with professionally designed templates, samples, and a library of vector stencils for drawing perfect Line Graphs.
 Sales Dashboard
Sales Dashboard solution extends ConceptDraw PRO software with templates, samples and library of vector stencils for drawing the visual dashboards of sale metrics and key performance indicators (KPI).
 Time Series Dashboard
Time series dashboard solution extends ConceptDraw PRO software with templates, samples and vector stencils libraries with charts, graphs and plots for drawing the visual dashboards showing data time series.
 Seating Plans
The correct and convenient arrangement of tables, chairs and other furniture in auditoriums, theaters, cinemas, banquet halls, restaurants, and many other premises and buildings which accommodate large quantity of people, has great value and in many cases requires drawing detailed plans. The Seating Plans Solution is specially developed for their easy construction.
 Divided Bar Diagrams
The Divided Bar Diagrams Solution extends the capabilities of ConceptDraw PRO v10 with templates, samples, and a library of vector stencils for drawing high impact and professional Divided Bar Diagrams and Graphs, Bar Diagram Math, and Stacked Graph.
Chart Maker for Presentations

 Comparison Dashboard
Comparison dashboard solution extends ConceptDraw PRO software with samples, templates and vector stencils library with charts and indicators for drawing the visual dashboard comparing data.
 What is a Dashboard Area
Solutions from the area What is a Dashboard of ConceptDraw Solution Park collects templates, samples and vector stencils libraries with of data driven charts and indicators for drawing the basic types of Visual Dashboards.
 Food Court
Use the Food Court solution to create food art. Pictures of food can be designed using libraries of food images, fruit art and pictures of vegetables.
 Sport Field Plans
Construction of sport complex, playgrounds, sport school, sport grounds and fields assumes creation clear plans, layouts, or sketches. In many cases you need represent on the plan multitude of details, including dimensions, placement of bleachers, lighting, considering important sport aspects and other special things.
 Baseball
The Baseball Solution extends ConceptDraw PRO v9.5 (or later) software with samples, templates, and libraries of vector objects for drawing baseball diagrams, plays, and illustrations. It can be used to make professional looking documents, presentations,
Bar Diagrams for Problem Solving. Create space science bar charts with Bar Graphs Solution

Create bar graphs for visual solving your scientific problems and data comparison using the ConceptDraw PRO diagramming and vector drawing software extended with the Bar Graphs Solution from the Graphs and Charts area of ConceptDraw Solition Park.
 Pie Charts
Pie Charts are extensively used in statistics and business for explaining data and work results, in mass media for comparison (i.e. to visualize the percentage for the parts of one total), and in many other fields. The Pie Charts solution for ConceptDraw PRO v10 offers powerful drawing tools, varied templates, samples, and a library of vector stencils for simple construction and design of Pie Charts, Donut Chart, and Pie Graph Worksheets.
 Circular Arrows Diagrams
Circular Arrows Diagrams solution extends ConceptDraw PRO v10 with extensive drawing tools, predesigned samples, Circular flow diagram template for quick start, and a library of ready circular arrow vector stencils for drawing Circular Arrow Diagrams, Segmented Cycle Diagrams, and Circular Flow Diagrams. The elements in this solution help managers, analysts, business advisers, marketing experts, scientists, lecturers, and other knowledge workers in their daily work.
- Design elements - Time series charts | Design elements ...
- Design elements - Comparison charts and indicators | Design ...
- Line Graphs | Line Graph Charting Software | Line graph template ...
- Design elements - Time series charts | Line Graphs | Line Chart ...
- Time Series Dashboard | Design elements - Time series charts ...
- Bar Diagrams for Problem Solving. Create space science bar charts ...
- How to Draw a Line Chart Quickly | Line Chart Examples | How to ...
- Design elements - Comparison charts and indicators | Comparison ...
- Bar Chart Software | Design elements - Bar Charts | Column Chart ...
- Line Chart Template for Word | Chart Maker for Presentations | Line ...
- How to Create a Line Chart | Design elements - Comparison charts ...
- Column Chart Software | Column Chart Examples | How to Create a ...
- Column Chart Software | Column Chart Examples | How to Create a ...
- Chart Maker for Presentations | Bar Chart Software | Bar Chart ...
- Bar Chart Software | Bar Chart Examples | How to Create a Bar ...
- Line Chart Examples | Line Graph Charting Software | Chart ...
- Comparison charts - Vector stencils library | Pie charts - Vector ...
- How to Draw a Line Chart Quickly | How to Create a Line Chart ...
- Create Graphs and Charts | How to Create a Line Chart | Line ...
- Time Series Dashboard | Time series digital dashboard - Template ...