Circle Spoke Diagram Template
ConceptDraw PRO diagramming and vector drawing software offers the Circle Spoke Diagram Template included in the Circle-Spoke Diagrams Solution from the "Diagrams" Area. Use of ready template is the easiest way of drawing professional looking Circle-Spoke Diagrams.3 Circle Venn. Venn Diagram Example
This example shows the 3 Circle Venn Diagram. The Venn Diagrams visualize all possible logical intersections between several sets. On this example you can see the intersections of 3 sets. Venn Diagrams are widely used in mathematics, logic, statistics, marketing, sociology, etc.2 Circle Venn Diagram. Venn Diagram Example
Using the ready-to-use predesigned objects, samples and templates from the Venn Diagrams Solution for ConceptDraw PRO you can create your own professional looking Venn Diagrams quick and easy.Venn Diagram Examples for Problem Solving. Venn Diagram as a Truth Table
Venn diagrams are illustrations used in the branch of mathematics known as set theory. They show the mathematical or logical relationship between different groups of things (sets). A Venn diagram shows all the possible logical relations between the sets.Venn Diagram Template for Word
This template shows the Venn Diagram. It was created in ConceptDraw PRO diagramming and vector drawing software using the ready-to-use objects from the Venn Diagrams Solution from the "Diagrams" area of ConceptDraw Solution Park.Fishbone Diagram Template
A causal model is an abstract concept, that describes the causal mechanisms of a system, by noting certain variables and their influence on each other, in an effort to discover the cause of a certain problem or flaw. This model is presented in diagram form by using a fishbone diagram. ConceptDraw PRO diagramming and vector drawing software enhanced with Fishbone Diagrams solution helps you create business productivity diagrams from Fishbone diagram templates and examples, that provide to start using of the graphic method for the analysis of problem causes. Each predesigned Fishbone Diagram template is ready to use and useful for instantly drawing your own Fishbone Diagram.HelpDesk
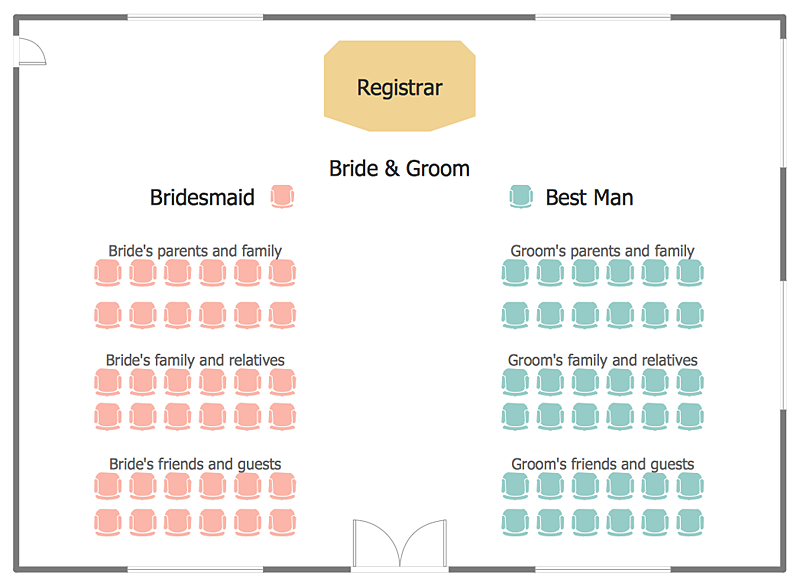
How to Create a Seating Chart for Wedding or Event
Making the guests invited to a wedding or any other special event feel as comfortable as possible, you necessary to take care of the preparation of the seating arrangements plan. That is why it is important to make a detailed table seating chart that will carefully positioning any invitee. Making a Seating Chart template with a help of seating chart software is the best way to represent and prepare a seating plan, for event participants and guests. The ability to design different seating plans is delivered by the ConceptDraw Seating Plans solution. Using ConceptDraw PRO simplifies the complex and cumbersome process of public events organization.Pie Chart Word Template. Pie Chart Examples
The Pie Chart visualizes the data as the proportional parts of a whole and looks like a disk divided into sectors. The pie chart is type of graph, pie chart looks as circle devided into sectors. Pie Charts are widely used in the business, statistics, analytics, mass media. It’s very effective way of displaying relative sizes of parts, the proportion of the whole thing.HelpDesk
How to Create SWOT Analysis Template Using ConceptDraw PRO
SWOT-analysis is used to develop a marketing strategy. SWOT-analysis includes determining the strengths and weaknesses in the company's activity, potential external threats and opportunities and assesses their relative strategic competitors. ConceptDraw SWOT and TOWS Matrix Diagrams solution provide a set of SWOT matrix in which should be recorded and then compared the strengths and weaknesses of the enterprise and the market opportunities and threats. This comparison allows you to determine what steps can be taken for the development of your company and what problems need to be addressed urgently.Target Diagram
Target Diagram is a convenient and visual way of presentation information which is popular and widely used in marketing, business and economics. ConceptDraw PRO diagramming and vector drawing software extended with Target and Circular Diagrams solution from the Marketing area of ConceptDraw Solution Park is ideal for fast and easy drawing a Target Diagram.Process Flowchart
The main reason of using Process Flowchart or PFD is to show relations between major parts of the system. Process Flowcharts are used in process engineering and chemical industry where there is a requirement of depicting relationships between major components only and not include minor parts. Process Flowcharts for single unit or multiple units differ in their structure and implementation. ConceptDraw PRO is Professional business process mapping software for making Process flowcharts, Process flow diagram, Workflow diagram, flowcharts and technical illustrations for business documents and also comprehensive visio for mac application. Easier define and document basic work and data flows, financial, production and quality management processes to increase efficiency of your business with ConcepDraw PRO. Business process mapping software with Flowchart Maker ConceptDraw PRO includes extensive drawing tools, rich examples and templates, process flowchart symbols and shape libraries, smart connectors that allow you create the flowcharts of complex processes, process flow diagrams, procedures and information exchange. Process Flowchart Solution is project management workflow tools which is part ConceptDraw Project marketing project management software. Drawing charts, diagrams, and network layouts has long been the monopoly of Microsoft Visio, making Mac users to struggle when needing such visio alternative like visio for mac, it requires only to view features, make a minor edit to, or print a diagram or chart. Thankfully to MS Visio alternative like ConceptDraw PRO software, this is cross-platform charting and business process management tool, now visio alternative for making sort of visio diagram is not a problem anymore however many people still name it business process visio tools.
Entity Relationship Diagram - ERD - Software for Design Crows Foot ER Diagrams
ER-model is a data model which lets describe the conceptual schemes in a specific subject area. It can help to highlight the key entities and specify relationships that can be established between these entities. During the database design, it is realized the transformation of ER model into certain database scheme based on the chosen data model (relational, object, network, etc.). There are used two notations for ERDs: Crow's Foot and Chen's. Crow's Foot notation proposed by Gordon Everest represents the entity by rectangle containing its name (name must be unique within this model), and relation - by the line which links two entities involved in relationship. The relationship's plurality is graphically indicated by a "plug" on the end of the link, the optionality - by a circle. Entity-Relationship Diagrams based on Crow's Foot notation can be easily drawn using the ConceptDraw PRO. Extended with Entity-Relationship Diagram (ERD) solution, it is the best ERD diagrams software with powerful tools and ready design elements for Crow's Foot and Chen notations.
HelpDesk
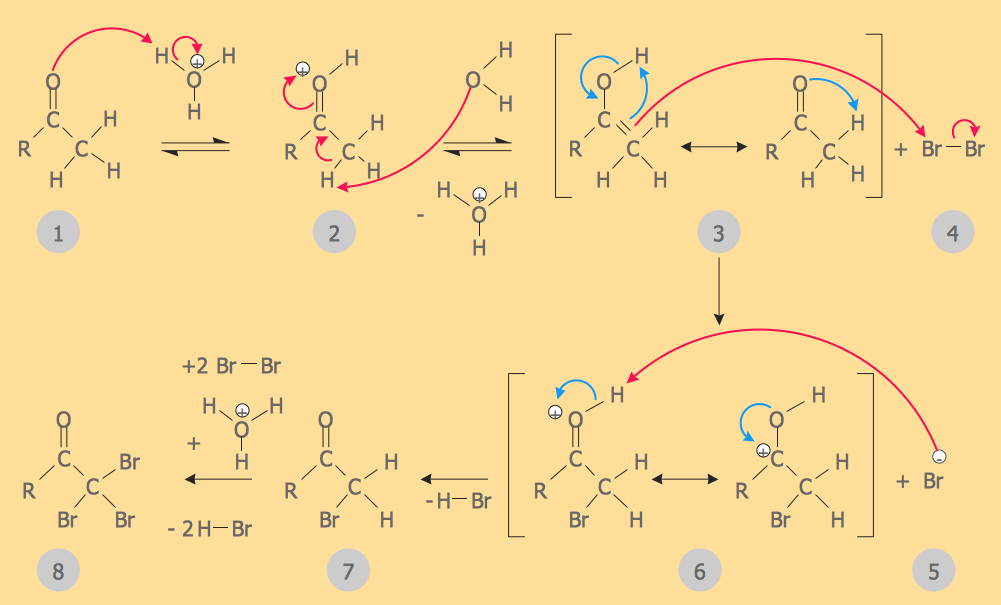
How to Draw Chemistry Structures
Making chemistry drawings for science and education purposes involves many different elements that can be managed using ConceptDraw PRO. ConceptDraw Chemistry solution can be used as a tool for creating chemical schemes and diagrams of chemical lab set-ups and labware, formulas, reaction schemes, and molecular structures. With ConceptDraw PRO you can easily create and communicate chemistry drawings of any complexity.
 Seating Plans
The correct and convenient arrangement of tables, chairs and other furniture in auditoriums, theaters, cinemas, banquet halls, restaurants, and many other premises and buildings which accommodate large quantity of people, has great value and in many cases requires drawing detailed plans. The Seating Plans Solution is specially developed for their easy construction.
 Pie Charts
Pie Charts are extensively used in statistics and business for explaining data and work results, in mass media for comparison (i.e. to visualize the percentage for the parts of one total), and in many other fields. The Pie Charts solution for ConceptDraw PRO v10 offers powerful drawing tools, varied templates, samples, and a library of vector stencils for simple construction and design of Pie Charts, Donut Chart, and Pie Graph Worksheets.
- A Students Time Table By Pie Chirt
- Time Management Circle Graph
- Sample Of Time Table In Building Restaurant Pie
- Blank Time Table Chart
- Time Table Pie Chart
- Time Management Tables And Pie Charts
- Pie Chart Examples and Templates | Schedule pie chart - Daily ...
- Schedule pie chart - Daily action plan | Pie Chart Examples and ...
- Hw To Draw Pie Chart To Time Table
- Circular Schedule
- Time Management Table Or Graph
- Time Management Table Oe Diagram
- Target and Circular Diagrams | Target Diagram | Circle Spoke ...
- Sample Pie Graph On Time Management
- Making A Time Table Graph
- Pie Chart On Time Table
- Tools To Make A Time Table Graph
- Schedule pie chart - Daily action plan | Pie Table Timetable
- Time Management Pie Chart Template
- Schedule pie chart - Daily action plan | Workflow Diagram Template ...


_Win_Mac.png)
