Accounting Data Flow from the Accounting Flowcharts Solution
Accounting Data Flow from the Accounting Flowcharts Solution visually describes the financial accounting process, shows the accumulated information about transactions and events for creating the balance sheet and the final income statement. Accounting Flowcharts Solution contains also a wide variety of templates and samples that you can use as the base for your own Accounting Flowcharts of any complexity.How to Create a Bar Chart
The answer how to create a bar chart can be found in ConceptDraw software. The simple tips guide you through the software to quickly learn how to create a bar chart.Rainfall Bar Chart
This sample shows the Horizontal Bar Chart of the average monthly rainfalls. This sample was created in ConceptDraw PRO diagramming and vector drawing software using the Bar Graphs Solution from the Graphs and Charts area of ConceptDraw Solution Park.Column Chart Examples
Column chart examples from ConceptDraw collection can help you find the best visual depiction for you data. You can easily modify column chart examples according to data you want to visualize.Bar Chart Examples
Complete set of bar chart examples is produced using ConceptDraw software. Surfing bar chart examples you can find an example that is the best for your case.
 Basic Pie Charts
This solution extends the capabilities of ConceptDraw PRO v10.3.0 (or later) with templates, samples, and a library of vector stencils for drawing pie and donut charts.
 IDEF Business Process Diagrams
Use the IDEF Business Process Diagrams solution to create effective database designs and object-oriented designs, following the integration definition methodology.
 Seven Basic Tools of Quality
Manage quality control in the workplace, using fishbone diagrams, flowcharts, Pareto charts and histograms, provided by the Seven Basic Tools of Quality solution.
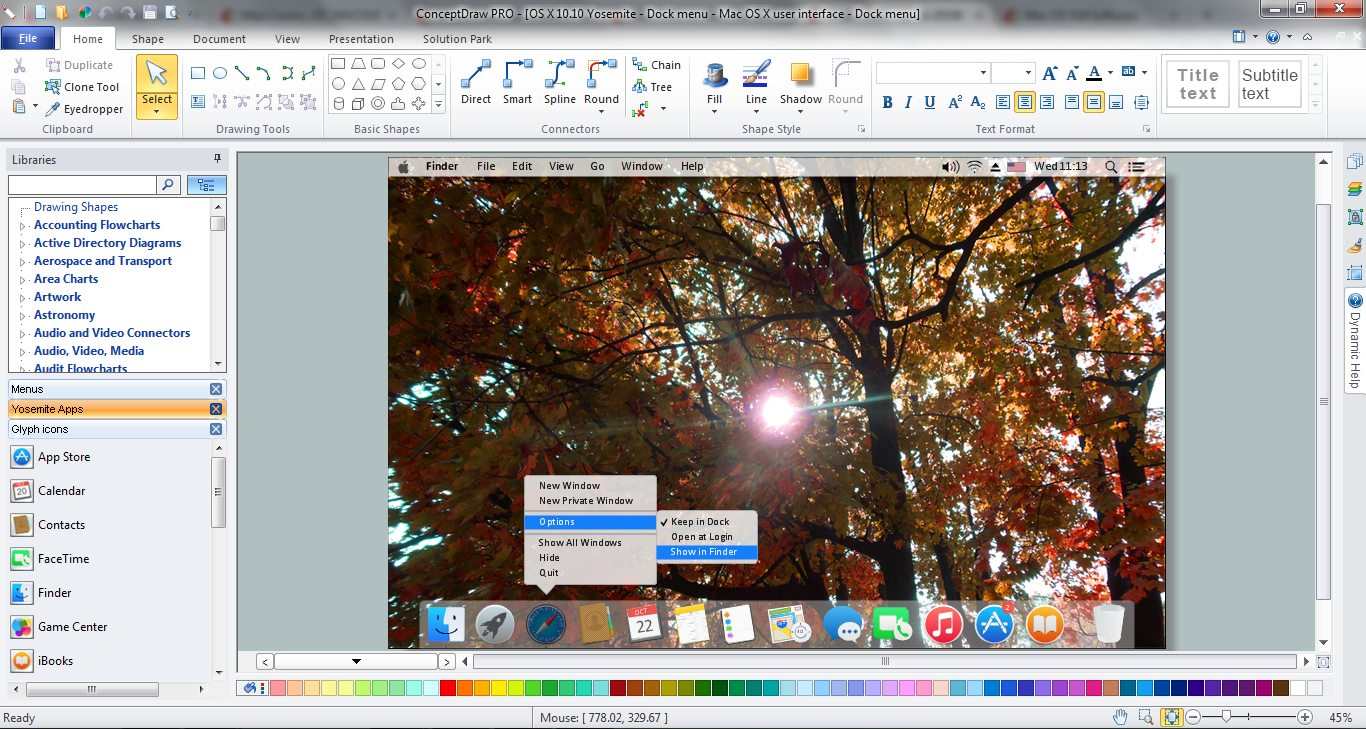
Mac OS GUI Software
ConceptDraw PRO diagramming and vector drawing software extended with Mac OS User Interface Solution from the Software Development area is a powerful Mac OS GUI SoftwareHelpDesk
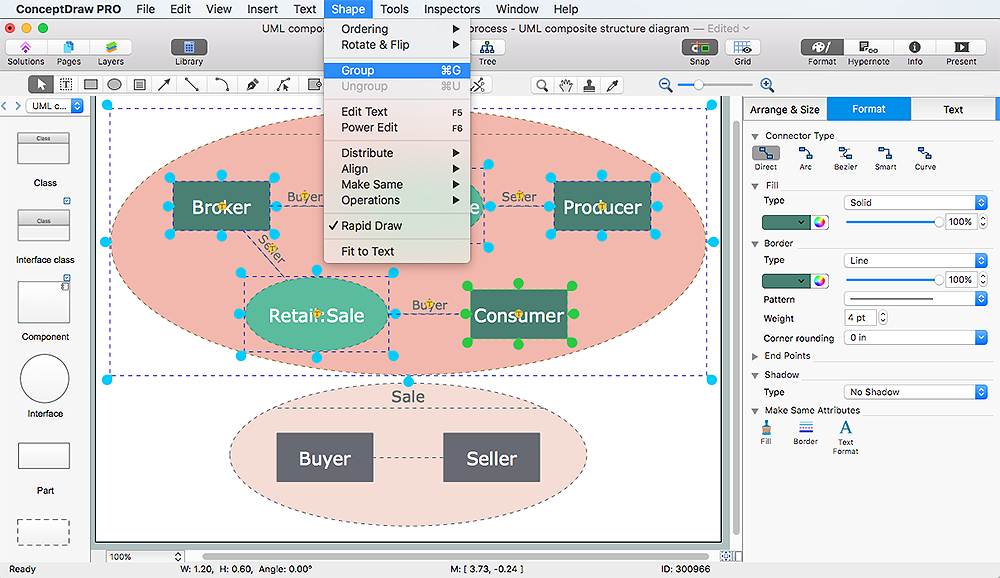
How to Edit Grouped Objects on Mac
ConceptDraw PRO offers a range of built-in facilities in order to enable you to quickly edit any diagram or other visualization made using ConceptDraw PRO, or MS Visio. Grouping shapes, pictures, or objects lets you style, format, rotate, and move them together, as though they were a single object.- Org Chart Titles
- Titles Organization Chart
- How to Create a Line Chart | How to Draw a Line Chart Quickly ...
- How to Create a Line Chart | How to draw Metro Map style ...
- Process Flowchart | Information Technology Architecture | Basic ...
- Sales Growth. Bar Graphs Example | Column Chart Examples ...
- Bar Chart Examples | Basic Diagramming | Rainfall Bar Chart ...
- Design elements - Time series charts | How to Create a Line Chart ...
- Bar Chart Examples | Rainfall Bar Chart | How to Create a Bar Chart ...


