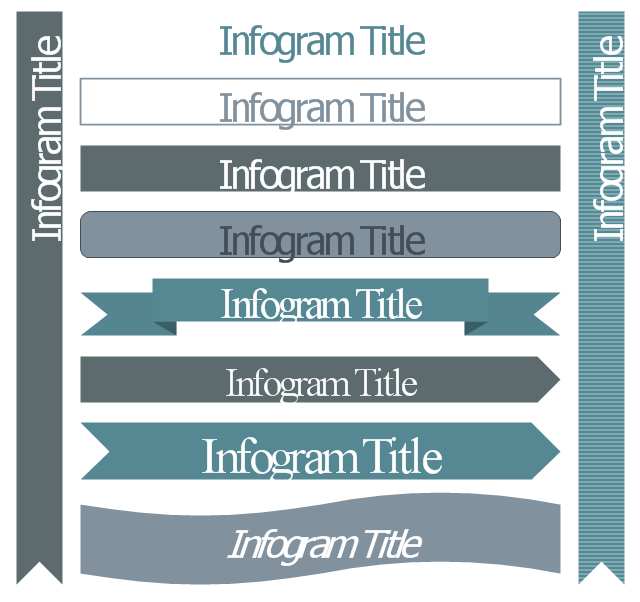
The vector stencils library "Management title blocks" contains 10 shapes: rectangle, rounded rectangle, ribbon, arrow, flag, bookmark.
Use it to design your management infogram.
The titles example "Design elements - Management title blocks" was created using the ConceptDraw PRO diagramming and vector drawing software extended with the Management Infographics solition from the area "Business Infographics" in ConceptDraw Solution Park.
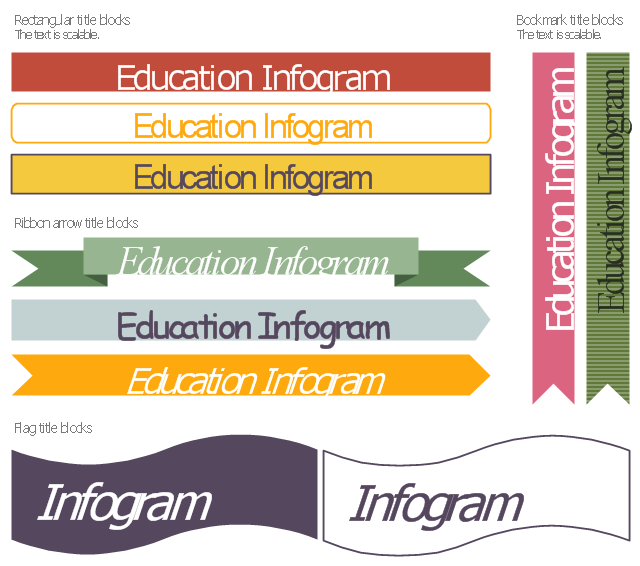
The vector stencils library "Education title blocks" contains 10 title block shapes: rectangular, arrow, ribbon, bookmark, flag.
Use these elements to design your educational infograms.
"The title of a book, or any other published text or work of art, is a name for the work which is usually chosen by the author. A title can be used to identify the work, to place it in context, to convey a minimal summary of its contents, and to pique the reader's curiosity." [Title (publishing). Wikipedia]
The shapes example "Design elements - Education title blocks" was created using the ConceptDraw PRO diagramming and vector drawing software extended with the Education Infographics solition from the area "Business Infographics" in ConceptDraw Solution Park.
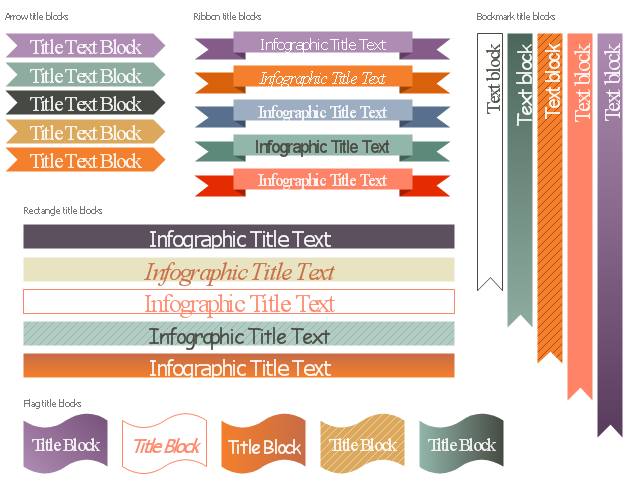
The vector stencils library "Title blocks" contains title and bookmark text blocks for creating marketing infograms.
"The title of a book, or any other published text or work of art, is a name for the work which is usually chosen by the author. A title can be used to identify the work, to place it in context, to convey a minimal summary of its contents, and to pique the reader's curiosity.
Some works supplement the title with a subtitle. Texts without separate titles may be referred to by their incipit, especially those produced before the practice of titling became popular. During development, a work may be referred to by a temporary working title. A piece of legislation may have both a short title and a long title. In library cataloging, a uniform title is assigned to a work whose title is ambiguous.In book design, the title is typically shown on the spine, the front cover, and the title page." [Title (publishing). Wikipedia]
The shapes example "Design elements - Title blocks" was created using the ConceptDraw PRO diagramming and vector drawing software extended with the Marketing Infographics solition from the area "Business Infographics" in ConceptDraw Solution Park.
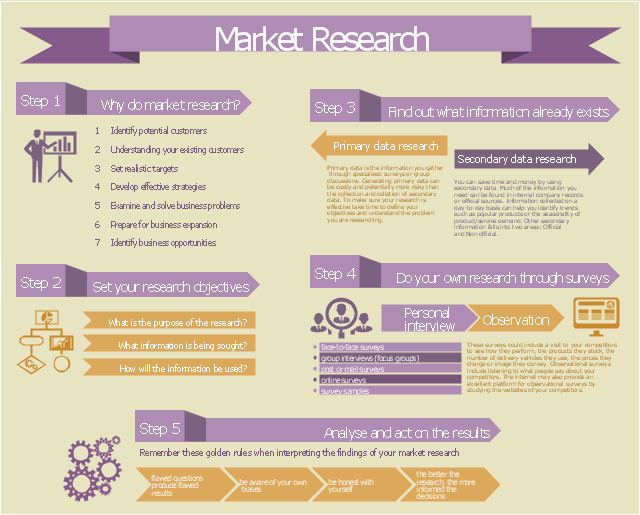
This example of marketing infogram was created on the base of web page "Market research" from the website of West Australian State Government agency Small Business Development Corporation (SBDC).
"Market research is a key part of developing your marketing strategy. It’s about collecting information to give you an insight into your customers’ mind so that you understand what they want, how they gather information and where they come from. You can also do market research to get a better idea of market trends and what is happening in your industry sector.
The information you gather and analyse builds the foundation of good business decisions whether it’s deciding what product or service you’ll offer, where your business should be located, how to distribute your products or how you communicate with consumers." [smallbusiness.wa.gov.au/ market-research]
The example "Marketing Infographics - Market Research" was created using the ConceptDraw PRO diagramming and vector drawing software extended with the Marketing Infographics solition from the area "Business Infographics" in ConceptDraw Solution Park.
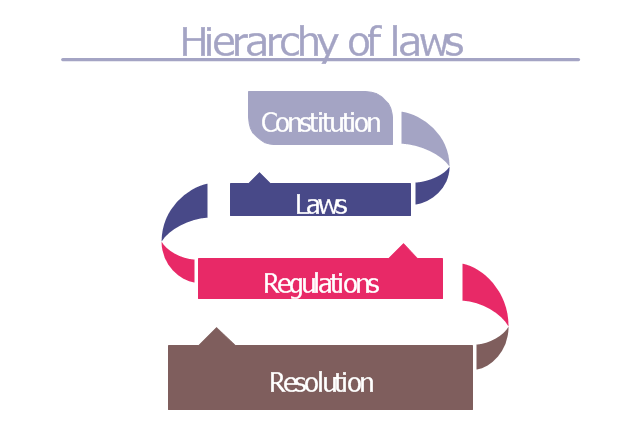
This typography infographics example was redesigned from the Wikimedia Commons file: Sentido jerarquico de las normas.png. [commons.wikimedia.org/ wiki/ File:Sentido_ jerarquico_ de_ las_ normas.png]
"Hierarchy of laws.
Article 1.2 of the Spanish Civil Code establishes that inferior and superior laws to be distinguished. However, the relationship between laws is not limited to a question of hierarchy, but also relationships of competency exist between some laws and others.
With effect to this, the Spanish Constitution of 1978 is the supreme law, which regulates all the complex relationships between the different laws and their place in the hierarchy.
The hierarchy of Spanish laws is thus:
(1) The Constitution.
(2) International treaties.
(3) The law in its strict sense: Organic Law (which requires an absolute majority from the Cortes Generales), ordinary law and regulatory laws (amongst which are found the Royal Decree of Law and the Legislative Royal Decree).
(4) Laws stemming from the executive, with its own hierarchy based on the function of the body that made them (Royal Decree, Decree, Ministerial Order, etc.)." [Law of Spain. Wikipedia]
The infographics example "Hierarchy of laws" was created using the ConceptDraw PRO diagramming and vector drawing software extended with the Typography Infographics solition from the area "What is infographics" in ConceptDraw Solution Park.
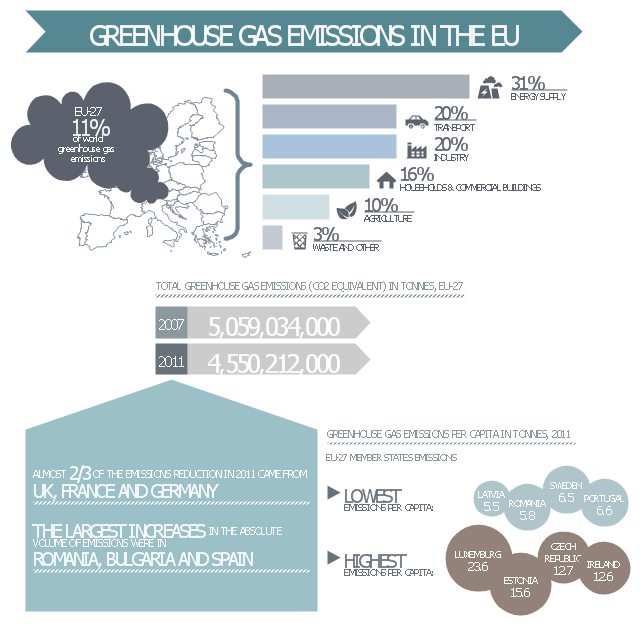
This ecology infographic example was created on the base of the infographics "Greenhouse gas emissions in the EU" from the Debating Europe website. [debatingeurope.eu/ wp-content/ uploads/ 2013/ 06/ TH_ 2_ social.png]
"A greenhouse gas (sometimes abbreviated GHG) is a gas in an atmosphere that absorbs and emits radiation within the thermal infrared range. This process is the fundamental cause of the greenhouse effect. The primary greenhouse gases in the Earth's atmosphere are water vapor, carbon dioxide, methane, nitrous oxide, and ozone. Greenhouse gases greatly affect the temperature of the Earth; without them, Earth's surface would average about 33 °C colder, which is about 59 °F below the present average of 14 °C (57 °F)." [Greenhouse gas. Wikipedia]
The ecology infographic example "EU greenhouse gas emissions" was created using the ConceptDraw PRO diagramming and vector drawing software extended with the Management Infographics solition from the area "Business Infographics" in ConceptDraw Solution Park.
Used Solutions
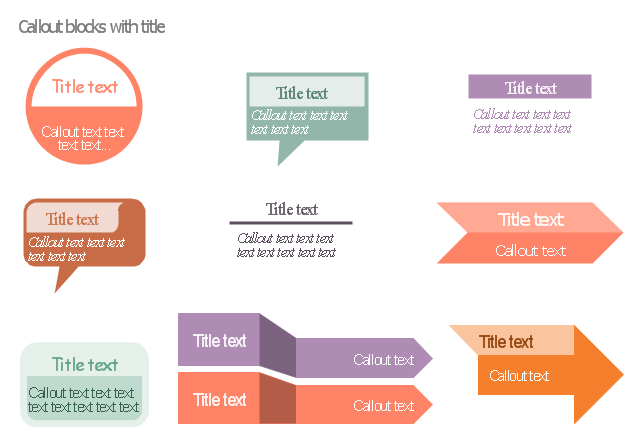
The vector stencils library "Titled callouts" contains 10 callout blocks with title and text.
Use it to design your marketing infograms.
The shapes example "Design elements - Titled callouts" was created using the ConceptDraw PRO diagramming and vector drawing software extended with the Marketing Infographics solition from the area "Business Infographics" in ConceptDraw Solution Park.
Use it to design your marketing infograms.
The shapes example "Design elements - Titled callouts" was created using the ConceptDraw PRO diagramming and vector drawing software extended with the Marketing Infographics solition from the area "Business Infographics" in ConceptDraw Solution Park.
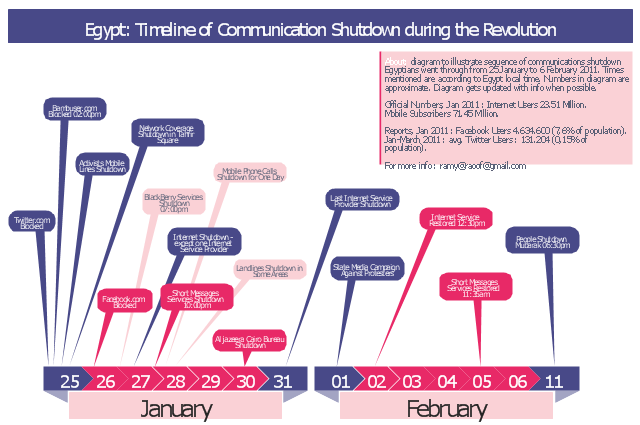
This typography infographics example was redesigned from the Wikimedia Commons file: Egypt timeline of communication shutdown during jan25revolution.jpg. [commons.wikimedia.org/ wiki/ File:Egypt_ timeline_ of_ communication_ shutdown_ during_ jan25revolution.jpg]
This file is licensed under the Creative Commons Attribution 3.0 Unported license. [creativecommons.org/ licenses/ by/ 3.0/ deed.en]
Diagram to illustrate sequence of communications shutdown Egyptians went through from 25 January to 06 February 2011. Times mentioned are according to Egypt local time. Numbers in the diagram are approximate. Last update of the diagram October 2011.
"2011 Internet shutdown.
Diagram to illustrate sequence of communications shutdown Egyptians went through from 25 January to 06 February 2011. Times mentioned are according to Egypt local time. Numbers in the diagram are approximate. Last update of the diagram October 2011.
The 2011 Egyptian protests began on 25 January 2011. As a result, on January 25 and 26, the government blocked Twitter in Egypt and later Facebook was blocked as well.
On January 27, various reports claimed that access to the Internet in the entire country had been shut down. ...
On February 2, connectivity was re-established by the four main Egyptian service providers. A week later, the heavy filtering that occurred at the height of the revolution had ended and bloggers and online activists who had been arrested were released." [Internet in Egypt. Wikipedia]
The example "Egypt timeline of communication shutdown during jan 25 revolution" was created using the ConceptDraw PRO diagramming and vector drawing software extended with the Typography Infographics solition from the area "What is infographics" in ConceptDraw Solution Park.
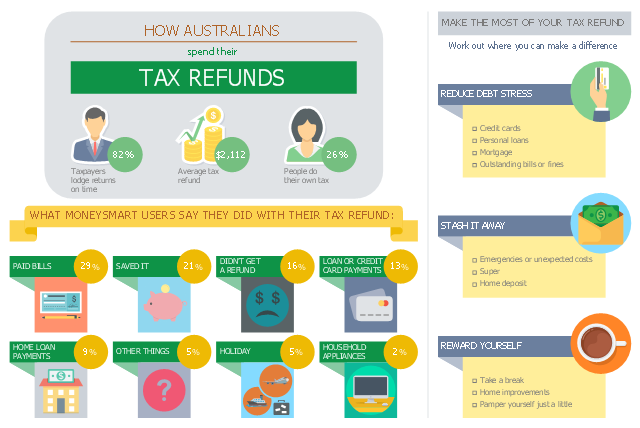
This business infographic sample shows the average tax refund and how people say they spent last year's tax refund. It was designed on the base of the infographic "How Australians spend their tax refunds" from the MoneySmart website of the Australian Securities and Investments Commission (ASIC).
[moneysmart.gov.au/ managing-your-money/ income-tax/ how-australians-spend-their-tax-refunds]
"A tax refund or tax rebate is a refund on taxes when the tax liability is less than the taxes paid. Taxpayers can often get a tax refund on their income tax if the tax they owe is less than the sum of the total amount of the withholding taxes and estimated taxes that they paid, plus the refundable tax credits that they claim. (Tax refunds are money given back at the end of the financial year.)" [Tax refund. Wikipedia]
The business infographic example "How Australians spend their tax refunds" was designed using ConceptDraw PRO diagramming and vector drawing software extended with the Business and Finance solution from Illustration area of ConceptDraw Solution Park.
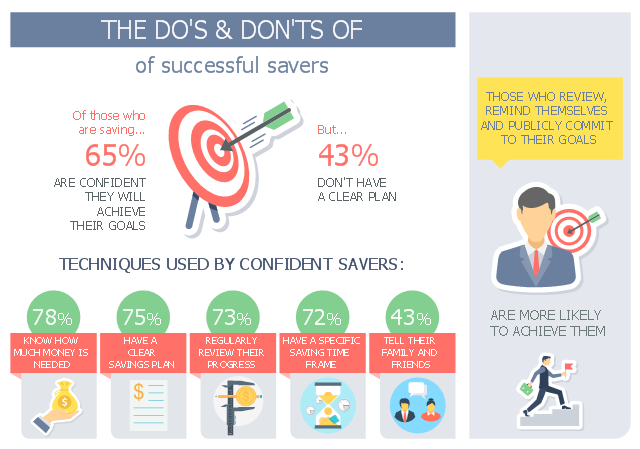
This business infographic sample shows how Australians save money, people's different saving styles as well as the techniques used by successful savers. It was designed on the base of the infographic "How Australians save money" from the MoneySmart website of the Australian Securities and Investments Commission (ASIC).
[moneysmart.gov.au/ managing-your-money/ saving/ how-australians-save-money]
"Saving is income not spent, or deferred consumption. Methods of saving include putting money aside in, for example, a deposit account, a pension account, an investment fund, or as cash. Saving also involves reducing expenditures, such as recurring costs. In terms of personal finance, saving generally specifies low-risk preservation of money, as in a deposit account, versus investment, wherein risk is higher; in economics more broadly, it refers to any income not used for immediate consumption." [Saving. Wikipedia]
The business infographic example "Do's and Don'ts of successful savers" was designed using ConceptDraw PRO diagramming and vector drawing software extended with the Business and Finance solution from Illustration area of ConceptDraw Solution Park.
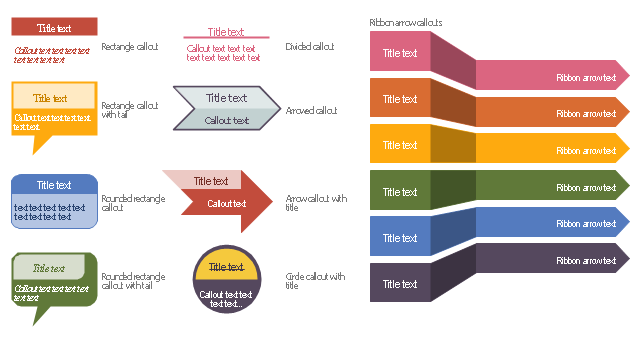
The vector stencils library "Education titled callouts" contains 14 titled callout blocks.
Use it to design your educational infograms.
"In publishing, a call-out or callout is a short string of text connected by a line, arrow, or similar graphic to a feature of an illustration or technical drawing, and giving information about that feature. The term is also used to describe a short piece of text set in larger type than the rest of the page and intended to attract attention.
A similar device in word processing is a special text box with or without a small "tail" that can be pointed to different locations on a document." [Callout. Wikipedia]
The shapes example "Design elements - Education titled callouts" was created using the ConceptDraw PRO diagramming and vector drawing software extended with the Education Infographics solition from the area "Business Infographics" in ConceptDraw Solution Park.
This business infographic sample shows how Australians save money, people's different saving styles as well as the techniques used by successful savers. It was designed on the base of the infographic "How Australians save money" from the MoneySmart website of the Australian Securities and Investments Commission (ASIC).
[moneysmart.gov.au/ managing-your-money/ saving/ how-australians-save-money]
"Saving is income not spent, or deferred consumption. Methods of saving include putting money aside in, for example, a deposit account, a pension account, an investment fund, or as cash. Saving also involves reducing expenditures, such as recurring costs. In terms of personal finance, saving generally specifies low-risk preservation of money, as in a deposit account, versus investment, wherein risk is higher; in economics more broadly, it refers to any income not used for immediate consumption." [Saving. Wikipedia]
The business infographic example "Do's and Don'ts of successful savers" was designed using ConceptDraw PRO diagramming and vector drawing software extended with the Business and Finance solution from Illustration area of ConceptDraw Solution Park.
[moneysmart.gov.au/ managing-your-money/ saving/ how-australians-save-money]
"Saving is income not spent, or deferred consumption. Methods of saving include putting money aside in, for example, a deposit account, a pension account, an investment fund, or as cash. Saving also involves reducing expenditures, such as recurring costs. In terms of personal finance, saving generally specifies low-risk preservation of money, as in a deposit account, versus investment, wherein risk is higher; in economics more broadly, it refers to any income not used for immediate consumption." [Saving. Wikipedia]
The business infographic example "Do's and Don'ts of successful savers" was designed using ConceptDraw PRO diagramming and vector drawing software extended with the Business and Finance solution from Illustration area of ConceptDraw Solution Park.
Education Information
The Education Information is multifariuos and can be often represented in various forms. Еру the most successful ways of presentation the information and data are various illustrations, diagrams and colorful education infographics which you can easily make in ConceptDraw PRO software extended with Education Infographics Solution from the Business Infographics Area.Social Media Marketing Infographic
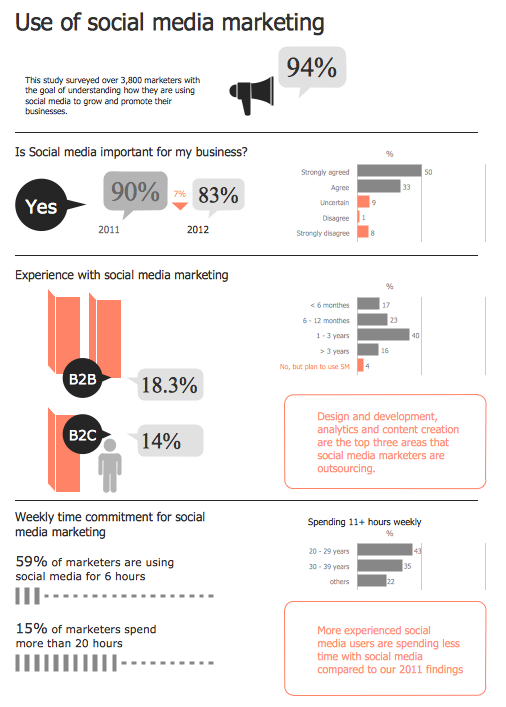
How to create Social Media Marketing Infographic? It’s very easy! All that you need is a powerful marketing infographics software. Never before creation of Social Media Marketing Infographic wasn’t so easy as now with tools of Marketing Infographics Solution from the Business Infographics Area for ConceptDraw Solution Park.- Flag Ribbon Png
- Rectangular Ribbon Png
- Ribbon Design Png
- Blue Ribbon Design Png
- Ribbon Designs Png
- Text Ribbon Png
- Png Title
- Design For Title Png
- Shape Ribbon Png
- Ribbon Text Box Png
- Ribbon Arrow Callout Png
- Design elements - Title blocks | SWOT analysis for a small ...
- Design elements - Title blocks | iPhone interface - Vector stencils ...
- Design elements - Title blocks | Word Exchange | Design elements ...
- How to Draw a Landscape Design Plan | Ribbrn Modern Arrow Png
- Minimize Icon Rectangle Png
- Ribbon interface - Vector stencils library | Ribbon interface - Vector ...
- Text Flag Png
- Bullet Ribbon Png
