TQM Diagram Tool
The Total Quality Management Diagram solution helps you and your organization visualize business and industrial processes. Create Total Quality Management diagrams for business process with ConceptDraw software.Probability Quality Control Tools
The Total Quality Management Diagram solution helps your organization visualize business and industrial processes. Create Total Quality Management diagrams for business process with ConceptDraw software.Management Tools — Total Quality Management
The Total Quality Management Diagram solution helps your organization visualize business and industrial processes. Create Total Quality Management diagrams for business process with ConceptDraw software.Social Media Response Management DFD Charts - software tools
ConceptDraw is your tool for driving social integration and managing change across and streamline social media processes of your organisation.This tool keeps the entire team on the same page allowing you to realize your social media strategy, improve the quality of your answers, and minimize the time it takes to respond.
Purposes of a Value Stream Management Tool
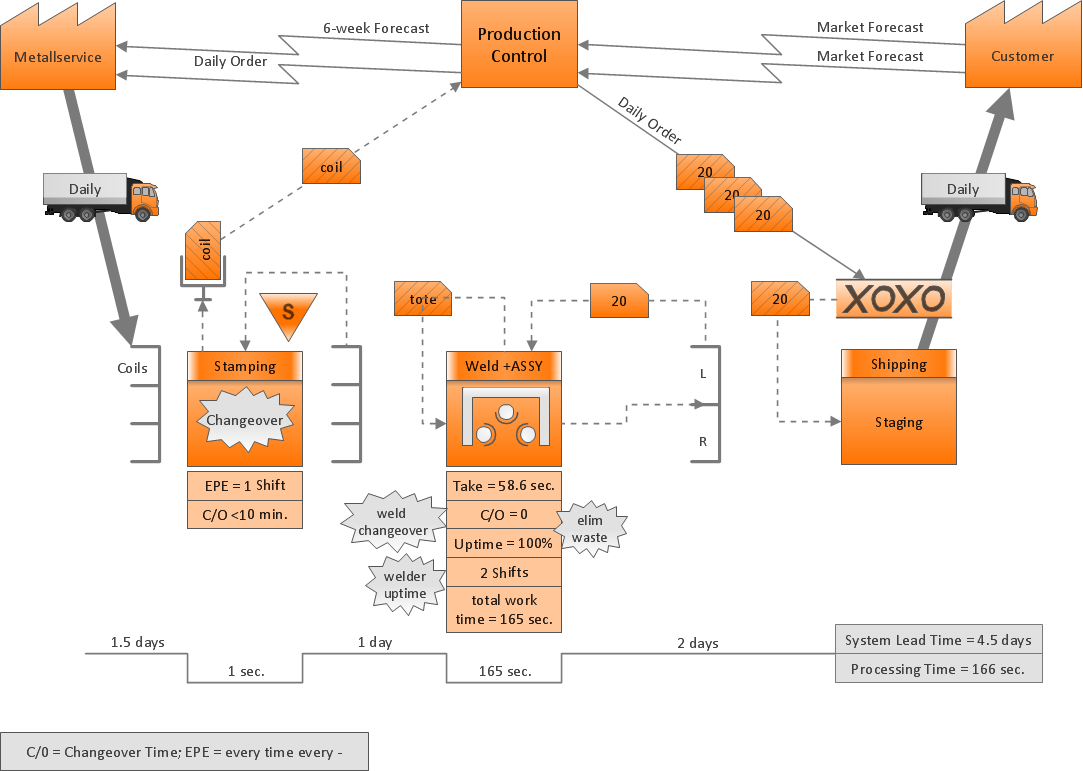
ConceptDraw Value Stream Maps visualize for a manufacturing plant the material and information flow required to deliver a product/service to customers.PROBLEM ANALYSIS. Root Cause Analysis Tree Diagram
Root Cause Analysis Tree Diagram. Use the Root Cause Diagram to perform visual root cause analysis. Root Cause Analysis Tree Diagram is constructed separately for each highly prioritized factor. The goal of this is to find the root causes for the factor and list possible corrective action. ConceptDraw Office suite is a software for problem analysis.
Social Media Response Management Action Maps - software tool
It is an innovative combination of interactive flow charts and action mind maps to help you boost your social media success.
Total Quality Management Value
The Total quality management (TQM) is an enterprise-wide method of continuous quality improvement of all organizational processes, including the enhancement of ability to deliver high-quality products and services to the customers. The TQM includes eight main elements, which have great value: customer-focused, process-centered, total employee involvement, integrated system, continual improvement, strategic and systematic approach, fact-based decision making, communications. ConceptDraw PRO diagramming and vector drawing software offers the Total Quality Management Diagram solution with effective drawing tools, predesigned vector elements, samples and templates that help easy design the Total Quality Management diagrams, TQM flowcharts and Mind Maps widely used in quality management projects to visualize the business processes and industrial processes for your organization, to demonstrate the quality control step-by-step in a visual manner, to compare visually the ideal and real stages of processes.Fundamental Tool in Quality Management
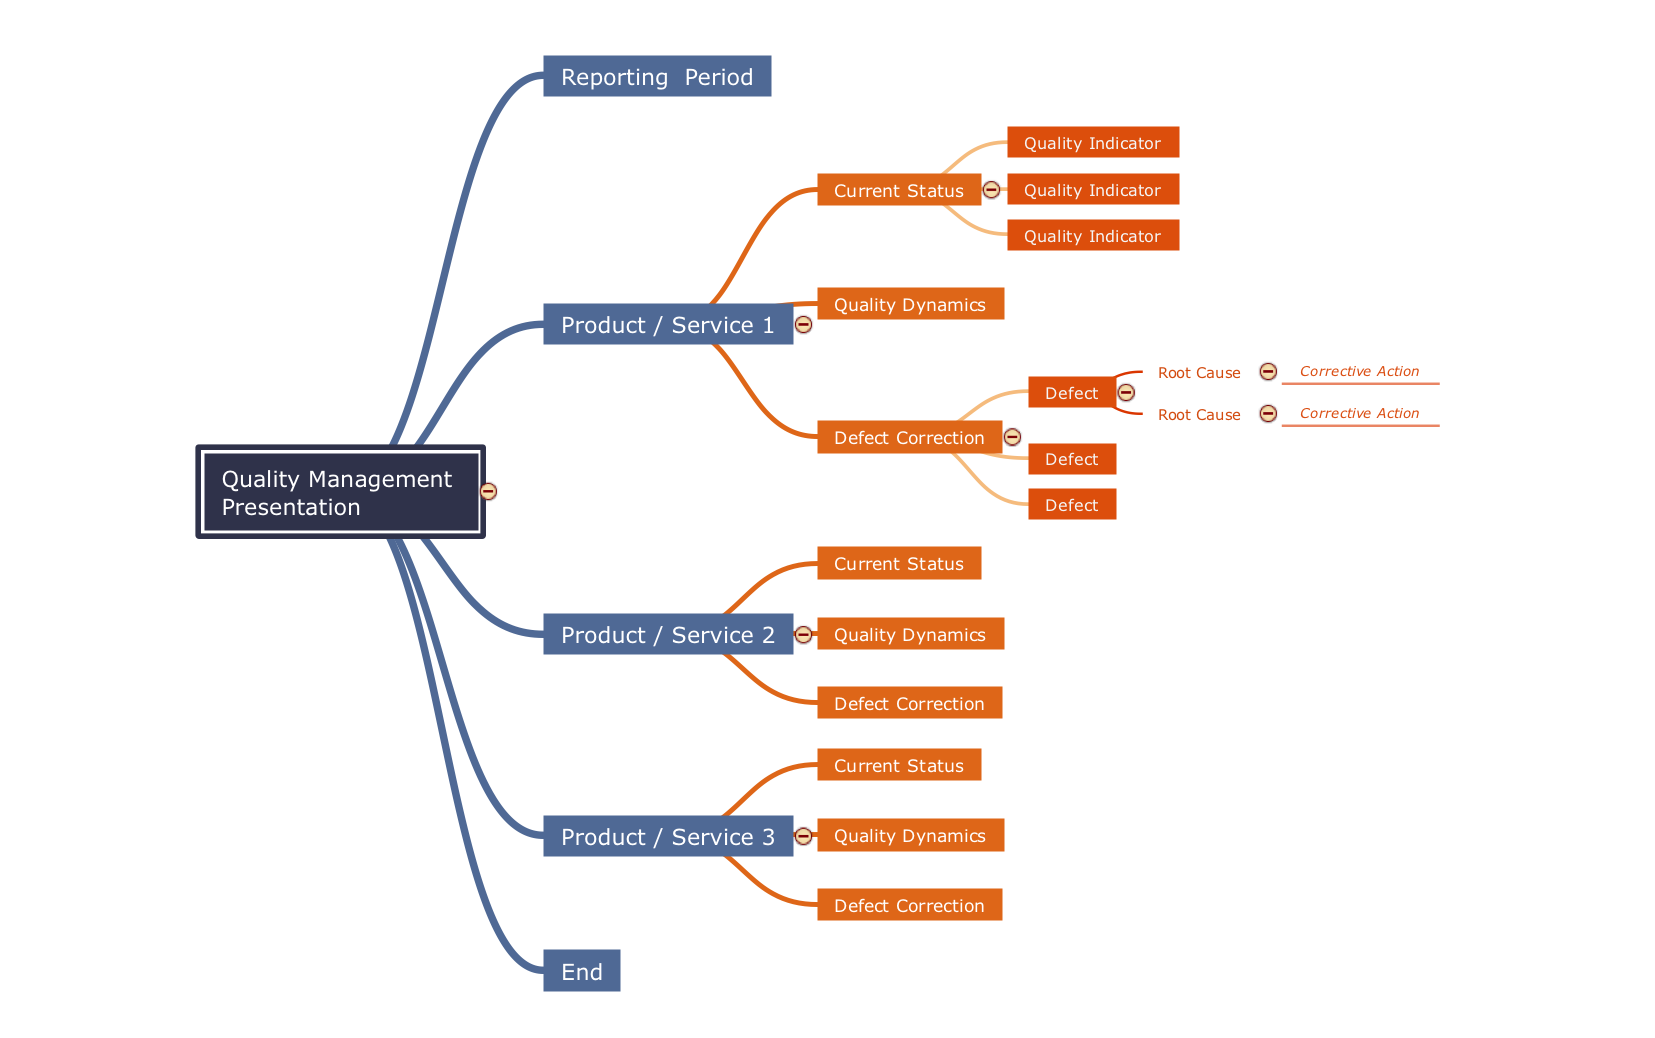
ConceptDraw MINDMAP is a fundamental tool in quality management to describe visual instructions on any process.
 Seven Management and Planning Tools
Seven Management and Planning Tools solution extends ConceptDraw PRO and ConceptDraw MINDMAP with features, templates, samples and libraries of vector stencils for drawing management mind maps and diagrams.
Quality Management Tools
ConceptDraw PRO diagramming and vector drawing software offers at your disposal quality management tools of the Total Quality Management (TQM) Diagrams solution from the Quality area of ConceptDraw Solution Park which will help facilitate a drawing diagrams process for quality management.Activity on Node Network Diagramming Tool
Activity on Node Network Diagramming Tool - Activity Network and Project Evaluation and Review Technique, or PERT, charts are a way of documenting and analyzing the tasks in a project. This sample shows the Activity on node network diagramming method. It was created in ConceptDraw PRO diagramming and vector drawing software using the Seven Management and Planning Tools solution from the Management area of ConceptDraw Solution Park.Decision Making
Decision Making - ConceptDraw Office suite provides visual tools that are given support on the stage of the decision making. The Seven Management and Planning Tools is a set for such diagrams: Affinity Diagram, Relations Diagram, Prioritization Matrix, Root Cause Tree Diagram, Involvement Matrix, PERT Chart, Risk Diagram (PDPC).
- Conceptdraw.com: Mind Map Software , Drawing Tools | Project ...
- Social Media Response Management DFD Charts - software tools ...
- TQM Diagram Tool | TQM Software — Build Professional TQM ...
- TQM Diagram Tool | Quality Management Tools | TQM Tools | Draw ...
- Entity-Relationship Diagram (ERD) | TQM Diagram Tool | Best Multi ...
- TQM Diagram Tool | Total Quality Management Value | Seven Basic ...
- Visual Management Tools
- Total Quality Management Value | Probability Quality Control Tools ...
- Diagram Software
- | ConceptDraw PROJECT Project Management Tool | Process ...
- Total Quality Management Value | TQM Diagram Tool | Total Quality ...
- TQM Diagram Example | Probability Quality Control Tools | TQM ...
- Total Quality Management Value | Quality Management Teams ...
- Basic Quality Check Tool
- ConceptDraw PROJECT Project Management Tool | Project —Task ...
- Block diagram - Total solution process | Total Quality Management ...
- Social Media Response Management DFD Charts - software tools ...
- Total Quality Management Value | TQM Diagram Tool | Pyramid ...
- Total Quality Management Value | Seven Basic Tools of Quality ...
- Activities In A Project Management Software With Example Diagram


-Diagram-in-SolutionBrowser.png)

