 Entity-Relationship Diagram (ERD)
An Entity-Relationship Diagram (ERD) is a visual presentation of entities and relationships. That type of diagrams is often used in the semi-structured or unstructured data in databases and information systems. At first glance ERD is similar to a flowch
Data structure diagram with ConceptDraw PRO
Data structure diagram (DSD) is intended for description of conceptual models of data (concepts and connections between them) in the graphic format for more obviousness. Data structure diagram includes entities description, connections between them and obligatory conditions and requirements which connect them. Create Data structure diagram with ConceptDraw PRO.Product Overview
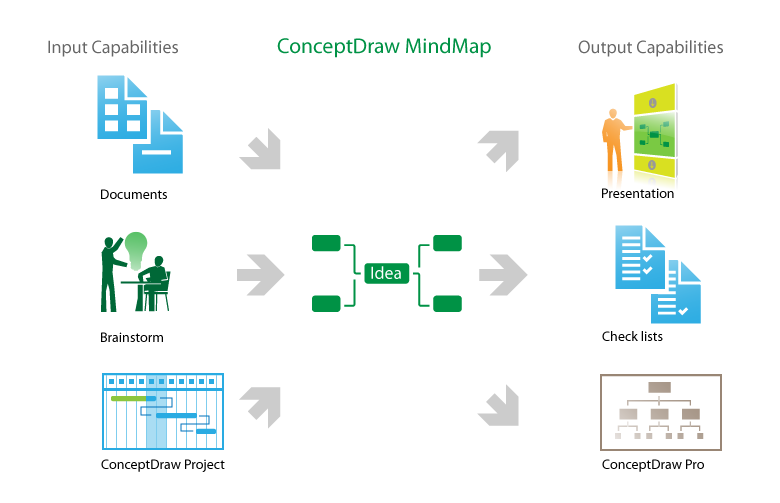
The role of ConceptDraw MINDMAP is to organize and plan idea development and communicate between process participants. Mind maps are convenient to prepare presentations for team and management and send task lists and related information.HelpDesk
How to Create a Bubble Diagram Using ConceptDraw PRO
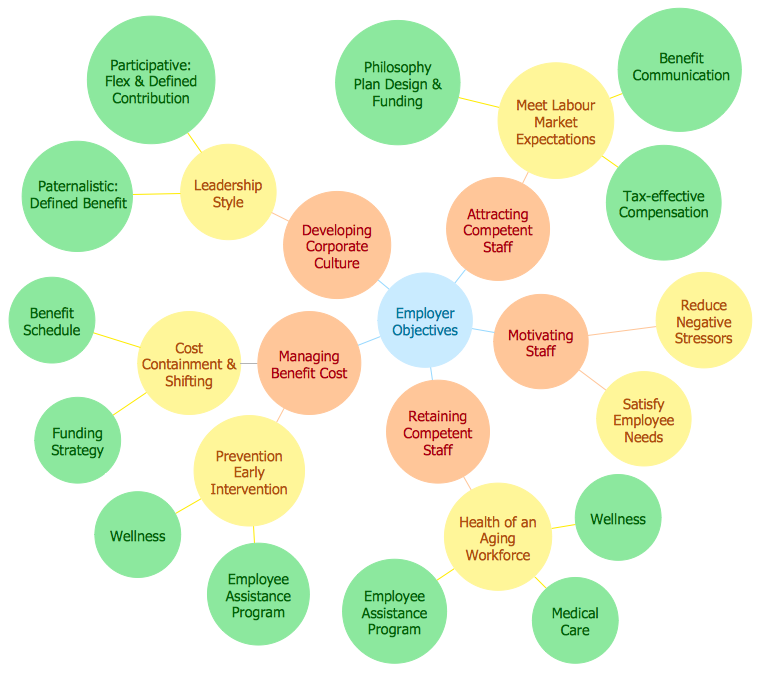
Bubble Diagram is a simple chart that consists of circles (bubbles) repesening certain topics or processes. Bubbles are connected by lines depicting the type of relationships between the bubbles. The size of each bubble is depended on the importance of the entity it represents. Bubble charts are widely used throughout social, economical, medical, and other scientific researches as well as throughout architecture and business management. Bubble charts are often used during the early stages of product development to visualize thoughts and ideas for the purpose of sketching out a development plan. ConceptDraw PRO allows you to draw a bubble diagrams using the Bubble Diagrams solution.
 Circle-Spoke Diagrams
Examples of subject areas that are well suited to this approach are marketing, business, products promotion, process modeling, market, resource, time, and cost analysis. Circle-Spoke Diagrams are successfully used in presentations, conferences, management documents, magazines, reportages, reviews, reports, TV, and social media.
 Basic Circle-Spoke Diagrams
Basic circle-spoke diagrams are well suited for marketing, management documents, and presentations.
How To Create Project Report
ConceptDraw PROJECT contains an extensive tool set to help project managers. The rich data visualization capability that is provided by ConceptDraw products helps you create project dashboards, one-click reports, multi-project views, Gantt charts, and resource views. Let′s learn how to get maximum value using ConceptDraw PROJECT!- Topics For Er Diagram
- Topics Of Presentation With Er Diagram
- How to Show the Relationship Between Topics | Entity Relationship ...
- Entity Relationship Diagram - ERD - Software for Design Crows Foot ...
- Entity Relationship Diagram Examples | ERD Symbols and ...
- Components of ER Diagram | Process Flowchart | Network Glossary ...
- Entity-Relationship Diagram (ERD) | Plumbing and Piping Plans ...
- Online Diagram Tool | Entity Relationship Diagram - ERD - Software ...
- Chen ERD Diagram | Entity Relationship Diagram - ERD - Software ...
- Design elements - ER diagram (Chen notation) | Flowcharts | Spatial ...
- Biochemistry Related Topic To Draw Diagram
- Bluetooth Pairing Erd Diagram
- Entity-Relationship Diagram (ERD) | Flow chart Example ...
- Free Sentence Diagrammer | Entity Relationship Diagram Examples ...
- Entity-Relationship Diagram
- Flow chart Example. Warehouse Flowchart | Entity-Relationship ...
- How to Connect an Image to a Topic in Your Mind Map | Process ...
- Entity Relationship Diagram Software Engineering | Business ...
- Graphics Program Draw ER Diagram Symbol By Using Standard
- ConceptDraw PRO ER Diagram Tool | Entity Relationship Software ...


